Figures & data
Table 1. Formulation and processing conditions of gliclazide loaded TSP-alginate microspheres.
Figure 1. SEM photograph of gliclazide loaded TSP-alginate microsphere (F4).
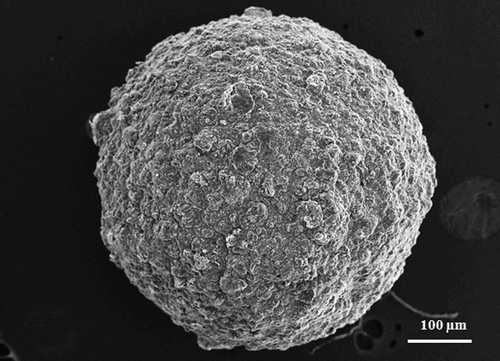
Figure 2. FTIR spectra of sodium alginate (1), TSP (2), gliclazide loaded TSP-alginate microspheres (3), and gliclazide (4).
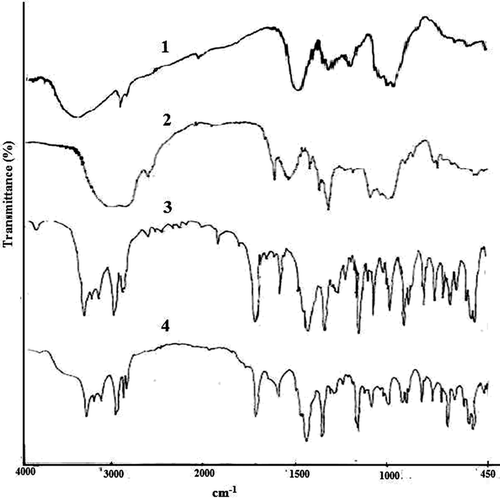
Figure 3. In vitro drug release from gliclazide loaded TSP-alginate microspheres in 0.1 N HCl, pH 1.2 (mean ± SD, = 3).
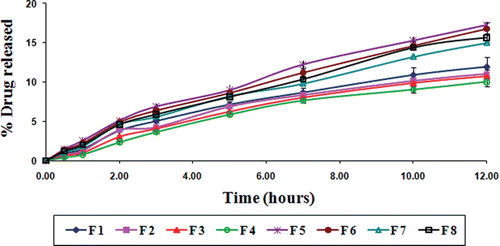
Figure 4. In vitro drug release from gliclazide loaded TSP-alginate microspheres in phosphate buffer, pH 7.4 (mean ± SD, = 3).
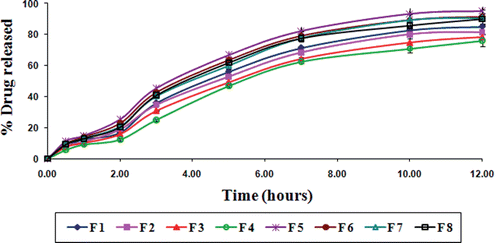
Figure 5. Swelling behavior profile of gliclazide loaded TSP-alginate microspheres in 0.1 N HCl, pH 1.2 (mean ± SD, n = 3).
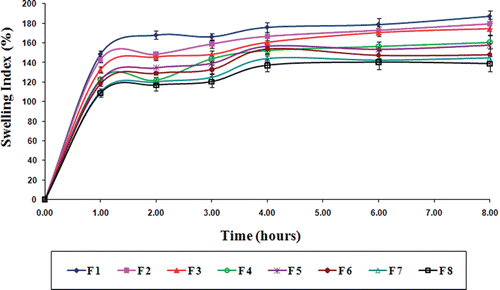
Figure 6. Swelling behavior profile of gliclazide loaded TSP-alginate microspheres in phosphate buffer, pH 7.4 (mean ± SD, n = 3).
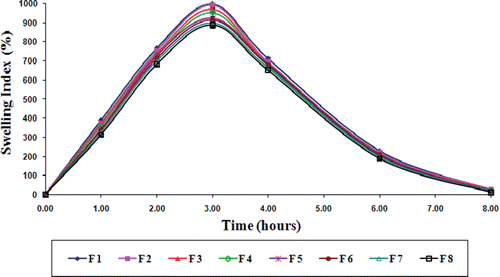
Figure 7. Results of in vitro wash-off test to assess mucoadhesive properties of gliclazide loaded TSP-alginate microspheres in 0.1 N HCl, pH 1.2 (mean ± SD, = 3).
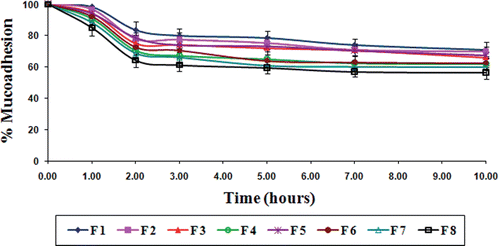
Figure 8. Results of in vitro wash-off test to assess mucoadhesive properties of gliclazide loaded TSP-alginate microspheres in phosphate buffer, pH 7.4 (mean ± SD, = 3).
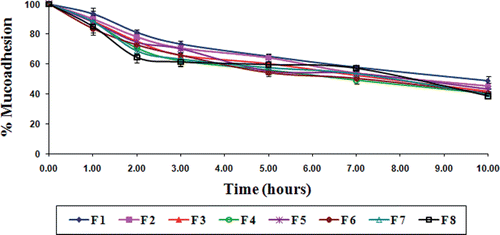
Figure 9. Comparative in vivo blood glucose level in alloxan-induced diabetic rats after oral administration of pure gliclazide and gliclazide loaded TSP-alginate mucoadhesive microspheres (F4) (mean ± SD, = 3). *Significant difference between blood glucose level after oral administration of pure gliclazide and gliclazide loaded TSP-alginate mucoadhesive microspheres (F4). The data were analyzed for significant differences (p < 0.05) by paired samples -test. The statistical analysis was conducted using MedCalc software version 9.6.4.0.
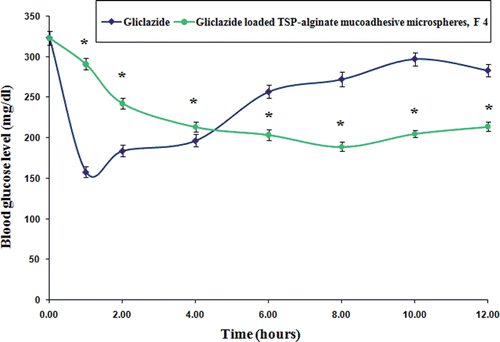
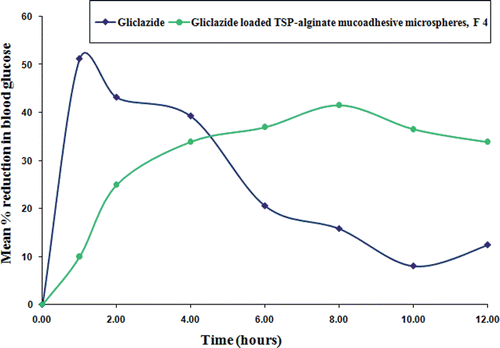
Figure 10. Comparative in vivo mean percentage reduction in blood glucose level in alloxan-induced diabetic rats after oral administration of pure gliclazide and gliclazide loaded TSP-alginate mucoadhesive microspheres (F4) (mean ± SD, n = 3).