Figures & data
Figure 1. Influence of different stabilizers on z-ave and PI of glimepiride in nanosuspensions (n = 3).
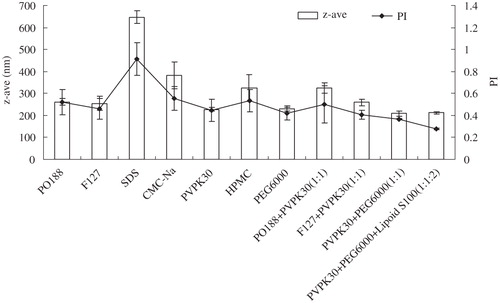
Figure 2. Influence of the ultrasonic power with 60 cycle numbers on z-ave and PI of glimepiride nanosuspensions (n = 3).
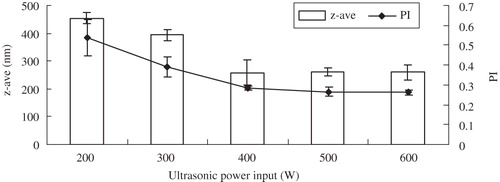
Figure 3. Influence of cycle numbers (at 500 W) on z-ave and PI of glimepiride nanosuspensions (n = 3).
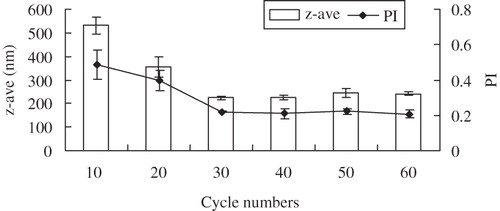
Table 1. The particle size, PI and appearance of the nanosuspensions.
Figure 4. Morphology of nanocrystal (A) and microcrystal formulations (B) of glimepiride.
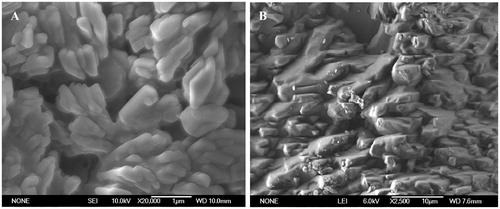
Figure 5. XRPD-spectra: bulk glimepiride (A), blank excipients (B), physical mixture (C), glimepiride nanocrystals (D) and microcrystals (E).
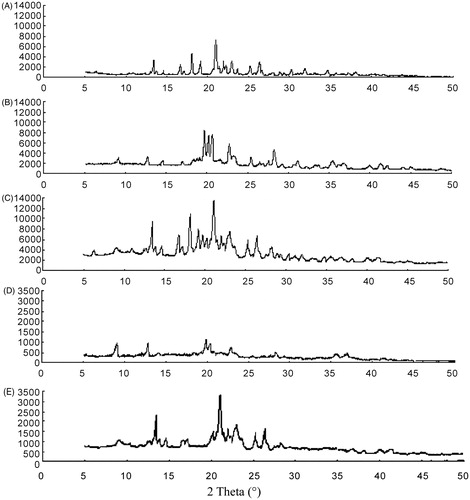
Figure 6. DSC curves of the bulk glimepiride (A), blank excipients (B), physical mixture (C), glimepiride nanocrystals (D) and microcrystals (E).
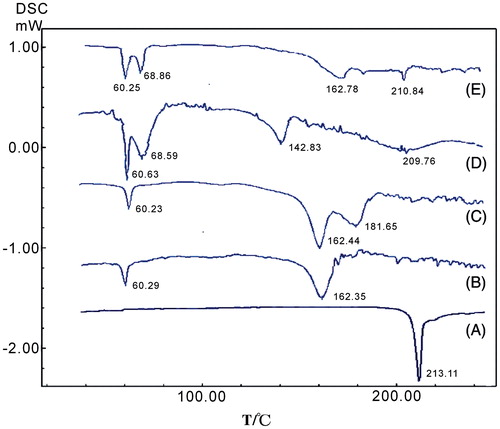
Figure 7. Dissolution profiles of glimepiride: nanocrystal-loaded capsules (▴), microcrystal-loaded capsules (▪) and marketed capsules (○) in different solvents (means ± S.D., n = 3).
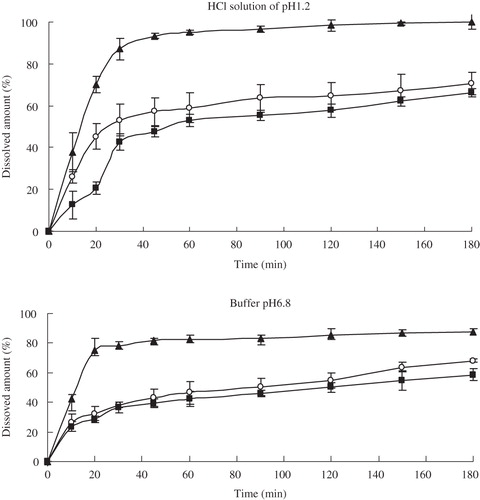
Figure 8. Saturation solubility (Cs) of different particle sizes for glimepiride (n = 3).
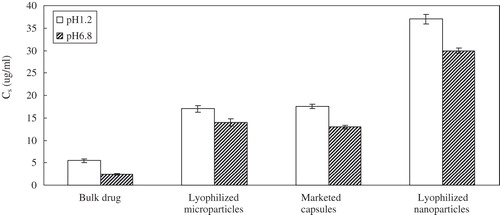
Figure 9. Average plasma concentration–time curves after i.g. administration of glimepiride nanoparticles-loaded capsules and reference formulations at a dose of 5 mg/kg in rats (n = 5).
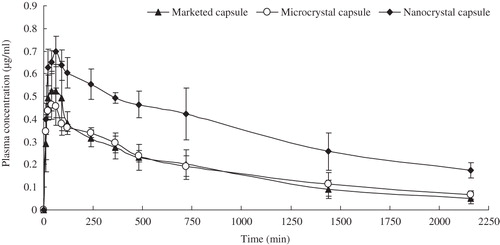
Table 2. PK parameters after i.g. administration of glimepiride nanoparticle capsules and reference formulations at a dose of 5 mg/kg (means ± S.D., n = 5).