Figures & data
Table 1. Effect of different variables on particle size, swelling index and entrapment efficiency.
Figure 1. DSC of: (a) aceclofenac; (b) pectin; and (c) aceclofenac-loaded pectin microspheres.
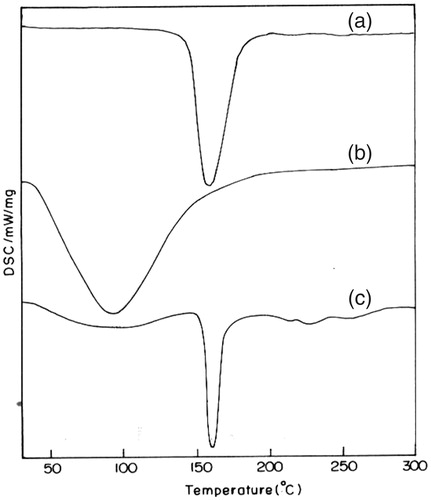
Figure 2. FT-IR of: (a) aceclofenac; (b) pectin; and (c) aceclofenac-loaded pectin microspheres.
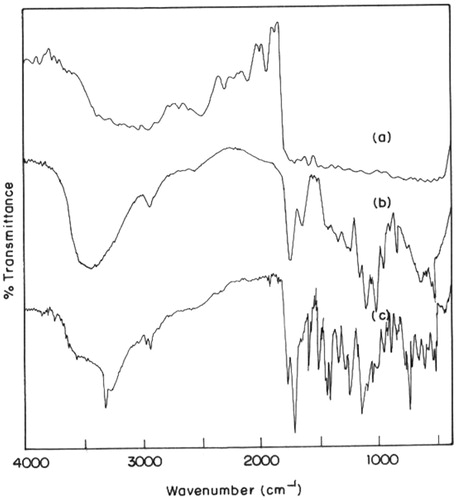
Figure 3. The cumulative percentage drug release in SCF enzyme induced medium (a) APM 1--APM 4, (b) APM 5--APM 8, (c) APM 9--APM 12, (d) APM 13--APM 16.
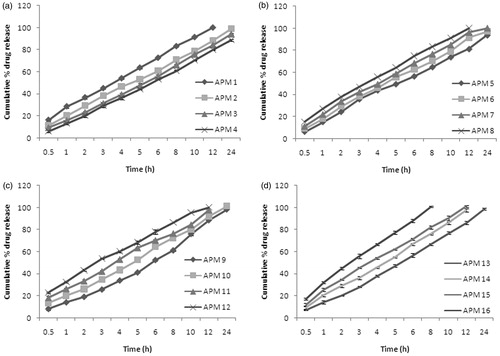
Figure 4. SEM photograph: (a) uncoated and (b) coated microspheres.
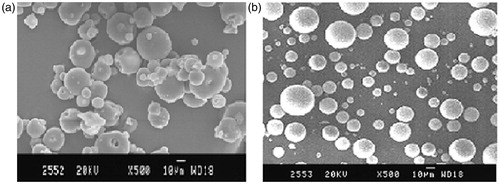
Figure 5. The %CDR of Eudragit-coated pectin microspheres and Eudragit microspheres alone in SCF.
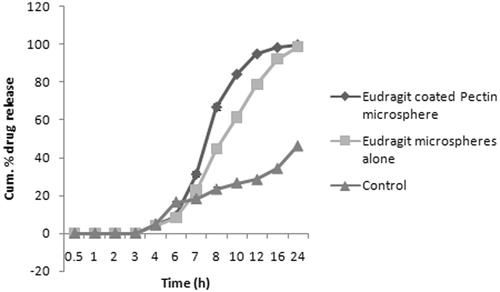
Table 2. Effect of test formulation (E-APM16) on CFA-induced paw edema in rats.
Table 3. Effect of test formulation (E-APM16) on antioxidant status in liver of control and experimental animals.
Figure 6. Plasma drug concentration–time curve.
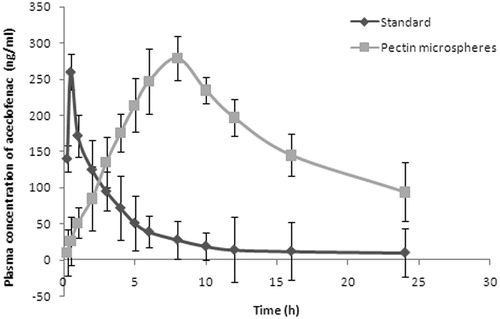
Table 4. Comparison of pharmacokinetic parameters of optimized batch microsphere (E-APM16) and standard.