Figures & data
Table 1. Quantities of material used for SLMs formulation.
Figure 1. DSC thermogram of (a) goat fat/Phospholipon® 90H blend, (b) Phospholipon® 90H and (c) goat fat.
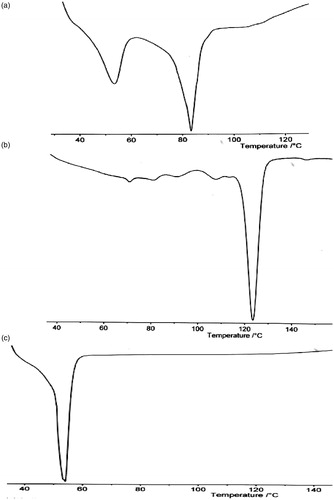
Figure 2. Time-resolved particle size analysis of the SLMs. A1–A4 contain 500 mg of MTH, B1–B4 contain 250 mg of MTH while C1–C4 contain no API. Points represent mean ± SD (n = 3).
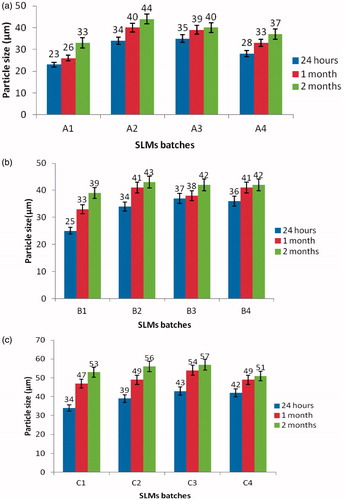
Table 2. Results of characterization of SLMs.
Figure 3. Representative of the morphology of the SLMs. A1, B1 and C1 contain 500 mg of MTH, 250 mg of MTH and no API, respectively.
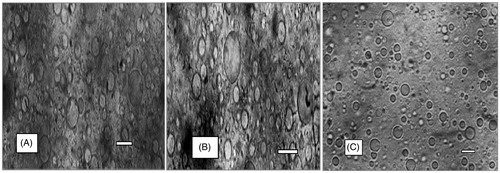
Figure 4. Percentage drug release from SLMs, (a) Batch A formulations containing 500 mg of MTH; (b) batch B formulations containing 250 mg of MTH. Points represents mean ± SD (n = 3).
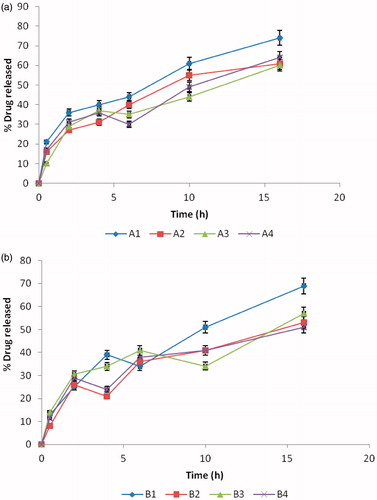
Table 3. Kinetics of release of MTH from SLMs in phosphate buffer.
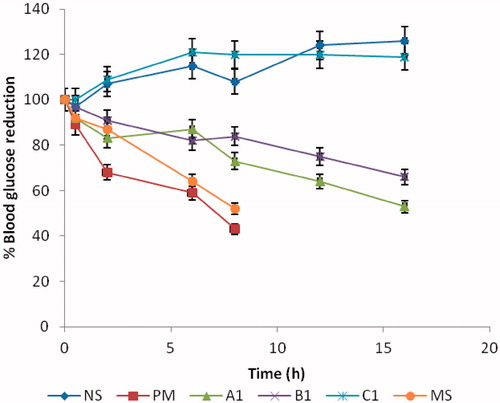
Figure 5. Changes in blood glucose levels after oral administration of control and the SLMs, NS = normal saline, PM = pure metformin HCl, A1 = MTH-loaded SLMs (500 mg), B1 = MTH-loaded SLMs (250 mg), C1- unloaded SLMs and MS = marketed sample (mean ± SD, n = 5).