Figures & data
Figure 1. Particle size distribution of (a) fluorescein sodium-loaded BSA nanoparticles; (b) glutathione-conjugated fluorescein sodium-loaded BSA nanoparticles.
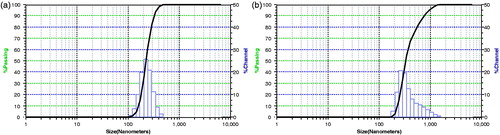
Figure 2. SEM image of (a) fluorescein sodium-loaded BSA nanoparticles; (b) glutathione-conjugated fluorescein sodium-loaded BSA nanoparticles.
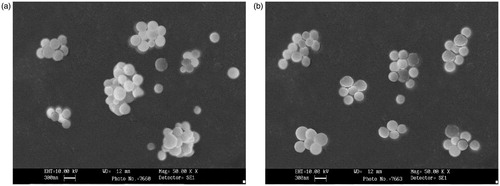
Table 1. Optimization of formulation variables to improve entrapment of fluorescein sodium inside the BSA nanoparticles.
Table 2. Effect of amount of EDAC on conjugation of glutathione with BSA nanoparticle.
Table 3. Effect of EDAC reaction time on conjugation of glutathione with BSA nanoparticles.
Figure 3. In vitro release profile of fluorescein sodium in phosphate buffer pH 7.4 from different formulations.
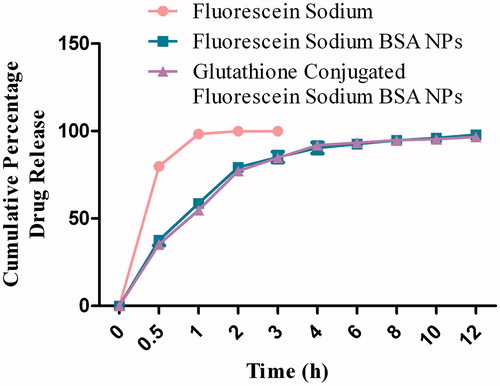
Figure 4. In vitro release profile of fluorescein sodium in phosphate buffer pH 4 from different formulations.
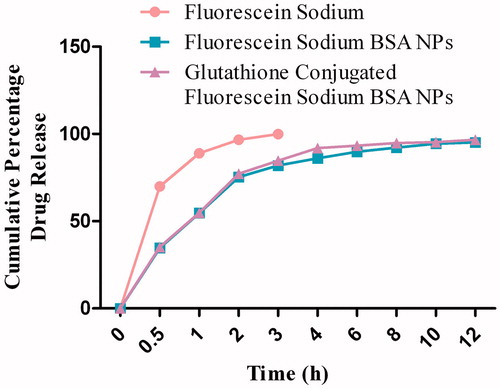
Figure 5. Effect of fluorescein sodium-loaded formulations on (a) MDCK-MDR1 cell viability; (b) primary neuro-glial cell viability.
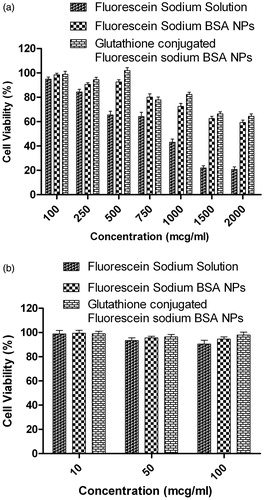
Figure 6. Apparent permeability of fluorescein sodium-loaded formulations through MDCK-MDR1 cell monolayer at different time interval.
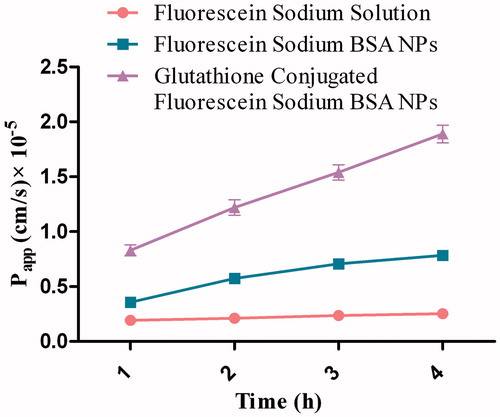
Table 4. The apparent permeability (Papp) of fluorescein sodium solution and glutathione-conjugated and unconjugated BSA nanoparticles loaded with fluorescein sodium across in vitro MDCK-MDR1 cell monolayer (n = 3).
Figure 7. Uptake of fluorescein sodium-loaded formulations by primary neuro-glial cells under fluorescent (left) and phase contrast (right) microscopy. (a) Blank control, (b) Fluorescein sodium solution, (c) Fluorescein sodium-loaded BSA nanoparticles, (d) Glutathione-conjugated fluorescein sodium-loaded BSA nanoparticles.
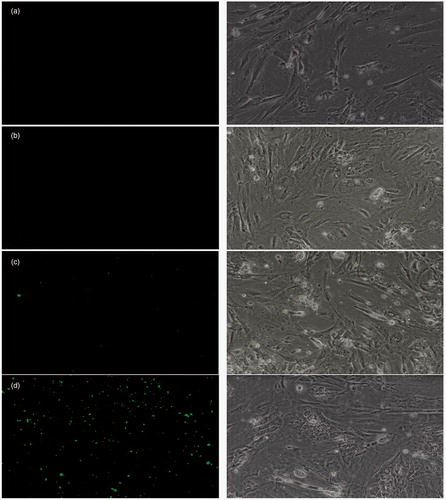
Figure 8. Fluorescein sodium concentrations (ng/mL) in different organs after intravenous injection of nanoparticles formulations.
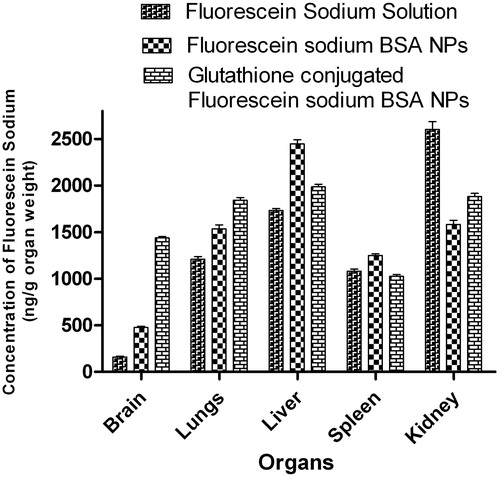
Table 5. Fluorescein sodium concentrations (ng/g organ weight) in different organs after intravenous injection of BSA nanoparticles.