Figures & data
Table 1. Live vaccination in C57BL/6 mice by using E7 in different formulations.
Figure 1. (A) Detection of E7-NT-GFP (left) and E7-CT-GFP (right) expression by Epi-fluorescent microscopy. (B) FACS analysis of un-transfected parasites as a negative control (gray color) in contrast with L.tar-GFP as a positive control (red color, left), L.tar-E7-CT-GFP (blue color, medium) and L.tar-E7-NT-GFP (red color, right) at logarithmic phase. (C) Detection of E7-NT-GFP (above) and E7-CT-GFP (below) proteins in the recombinant live vectors by western blotting. Western blot analysis using an anti-GFP and anti-E7 antibodies showed high levels of expression of the full-length E7-NT-GFP (∼81 kDa) and E7-CT-GFP (∼72 kDa) proteins, respectively. GFP was detected at 27 kDa for L.tar-GFP as a positive control.
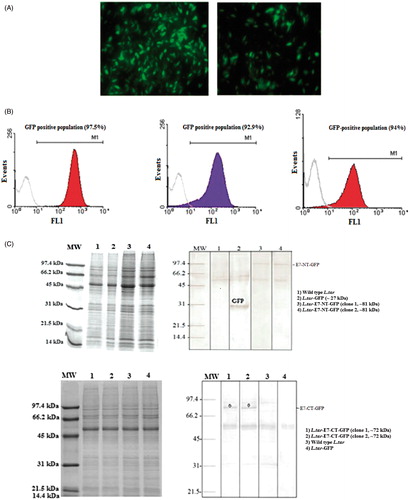
Figure 2. The levels of IFN-γ were measured by a sandwich ELISA in culture supernatants of splenocytes following in vitro re-stimulation with the recombinant proteins and freez-thaw (F/T) transgenic L. tarentolae promastigotes. Vaccination with L.tar-E7-CT-GFP (G1) and L.tar-E7-NT-GFP (G2) induces IFN-γ production at before (A), 3 weeks (B) and 6 weeks (C) after challenge. p Values <0.05 have indicated statistically significant differences between G1/G2 and G3 vaccinated mice. The mean of ConA concentration is more than 600 pg/ml in all groups.
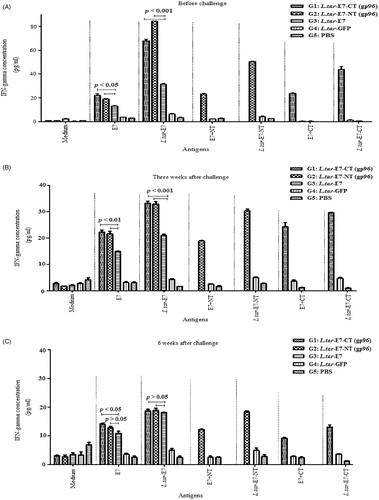
Figure 3. Before (A) and 2 weeks (B) after challenge, mice were bled and the pooled sera from each group were used to determine antibody levels against different antigens by ELISA. Data represent means ± SD and each assay was performed in duplicate. p Values <0.05 have indicated statistically significant differences between G1/G2 and G3 vaccinated mice.
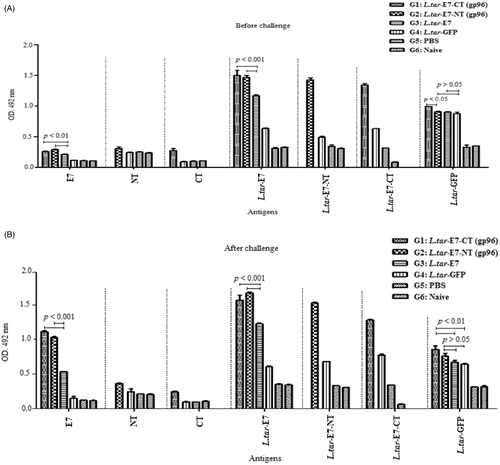
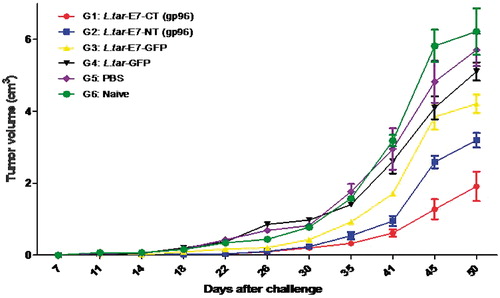
Figure 4. In vivo tumor protection experiments: C57BL/6 mice were subcutaneously challenged with 1 × 10⁵/mouse of TC-1 tumor cells; Line graph depicting the tumor volumes in TC-1 tumor bearing mice treated with different regimens and untreated TC-1 tumor-bearing mice used as a control. Data is shown as means ± SD.