Figures & data
Figure 1. Different actions between P-rHDL or cP-rHDL with LCAT.
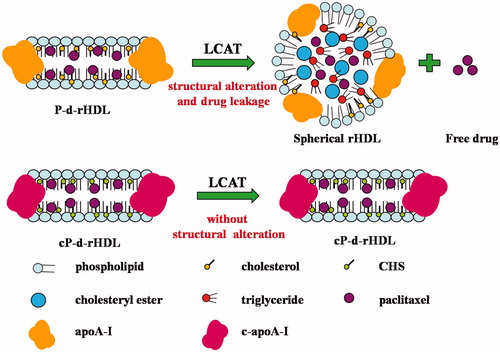
Table 1. Average diameter, zeta potential value and entrapment efficiency of cP-liposome and cP-d-rHDL (mean ± SD, n = 3).
Figure 2. Microphotographs of different preparations using transmission electron microscope. (A) P-d-rHDL in the absence of LCAT; (B) P-d-rHDL incubation with LCAT; (C) cP-d-rHDL in the absence of LCAT; (D) cP-d-rHDL incubation with LCAT.
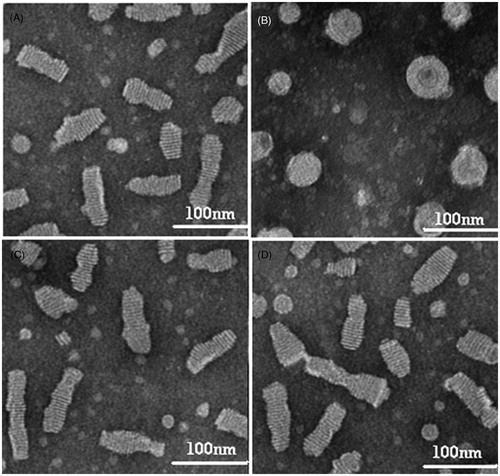
Table 2. Cytotoxicity of P-d-rHDL and cP-d-rHDL with or without LCAT against MCF-7 cells (mean ± SD, n = 3).
Figure 3. Profiles of uptake percentages versus time of different preparations (mean ± S.D., n = 3). (▪) P-d-rHDL; (♦) P-d-rHDLs incubation with LCAT; (▴) cP-d-rHDL; (•) cP-d-rHDL incubation with LCAT.
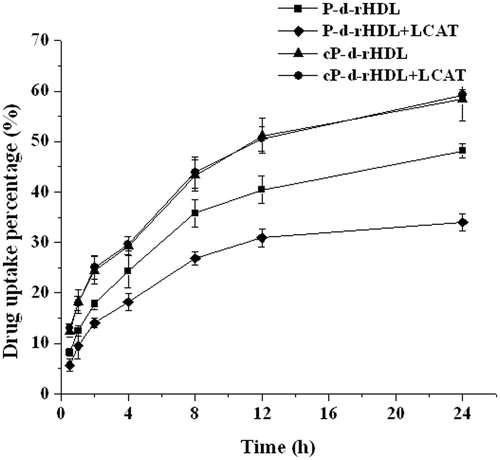
Figure 4. Tumor distribution of PTX after intravenous administration of Taxol, P-L, P-d-rHDL and cP-d-rHDL in tumor bearing mice (n = 3).
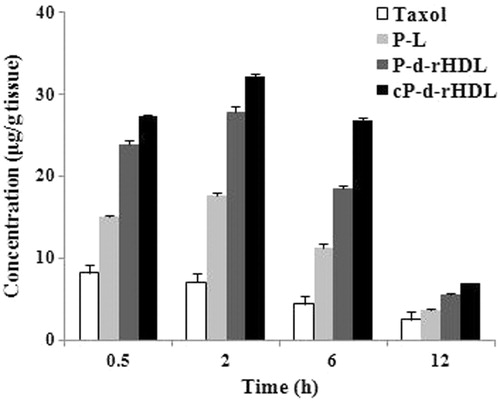
Figure 5. The tumor growing curves for different treatment groups (n = 6).
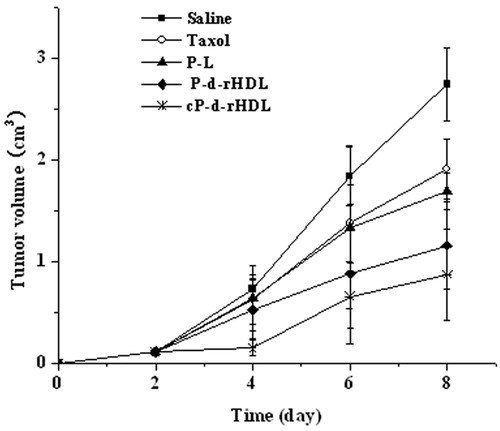
Figure 6. The tumor weight of mice after treatments with different formulations (n = 6). Significant differences: *p < 0.05, **p < 0.01, compared with saline group.
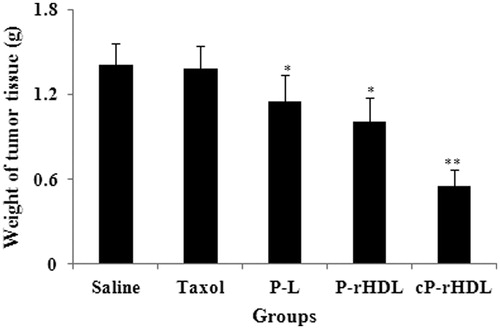
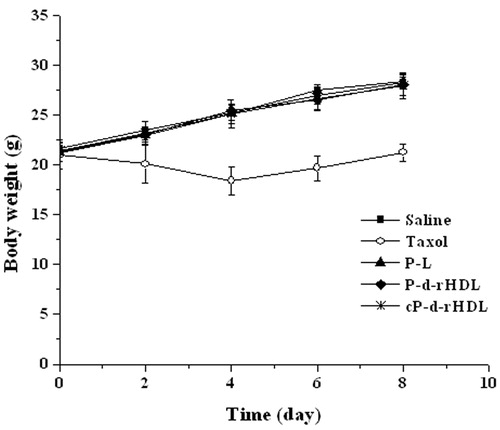
Figure 7. The body weight of mice after treatments with different formulations (n = 6).