Figures & data
Table 1. Composition of nanoemulsion formulations.
Figure 1. Microscopic images illustrate the histopathological condition of nasal mucosa after 2 h exposure of (A, negative control) PBS pH 6.4; (B, positive control) IPA; (C) drug-loaded nanoemulsion.
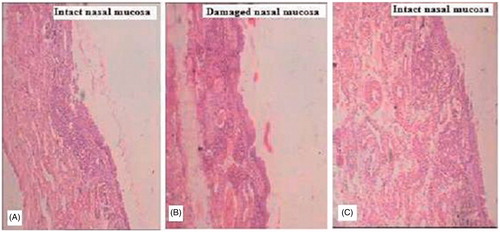
Figure 2. SQVM concentration–time profiles after intranasal administration of nanoemulsion and IV administration of PDS at 100 µg doses in rats brain (A) and blood (B).
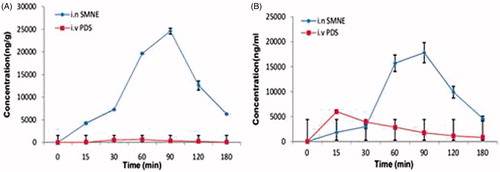
Table 2. Pharmacokinetics parameters of SQVM following nasal and intravenous administration.
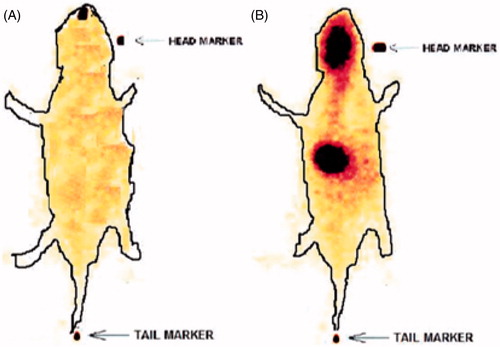
Figure 3. Scintigraphy image of rat at (A) 0 h and (B) 1.0 h following intranasal administration of drug loaded nanoemulsion.