Figures & data
Figure 1. Synthesis route of (a) ImIL, (b) ImIL-MSNs and (c) ImIL-MSNs-PMAA.
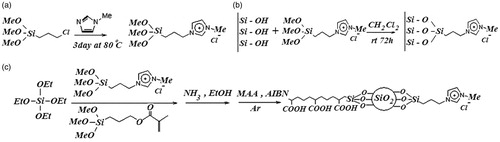
Figure 2. FTIR spectra of (a) silica nanoparticles, (b) ImIL, (c) ImIL-MSNs, (d) ImIL-MSNs-PMAA and (e) MTX-loaded ImIL-MSNs-PMAA.
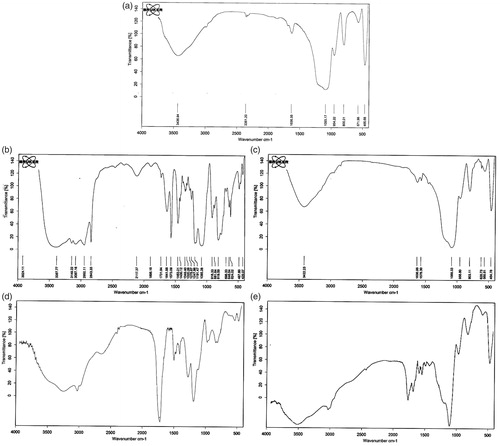
Figure 3. 1H NMR spectrum of ImIL.
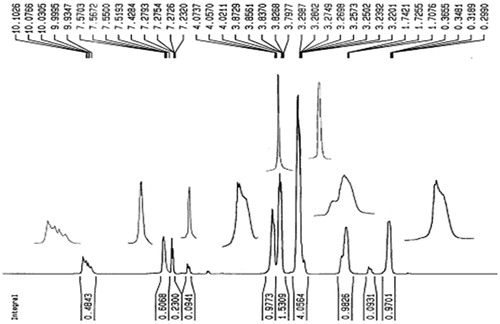
Figure 4. TGA thermogram of ImIL-MSNs-PMAA nanocomposites.
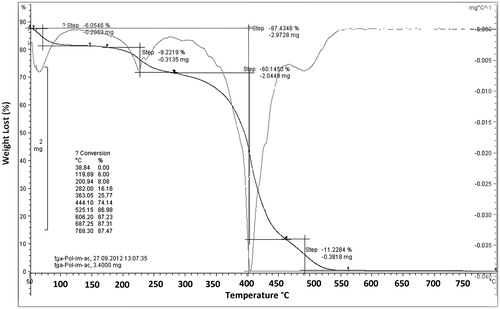
Figure 5. SEM images of (a) silica nanoparticles, (b) ImIL-MSNs nanocomposites, (c) ImIL-MSNs-PMAA nanocomposites, (d) MTX-loaded ImIL-MSNs nanocomposites, (e) MTX-loaded ImIL-MSNs-PMAA nanocomposites, (f) selected area EDX analysis for ImIL-MSNs nanocomposite and its elemental composition and (g) selected area EDX analysis for ImIL-MSNs-PMAA nanocomposite and its elemental composition.
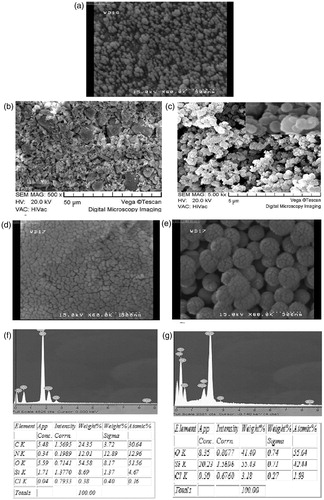
Table 1. Loading percentages of various MTX-loaded MSN samples.
Figure 6. Schematic root of MTX loading and release on ImIL-MSNs (a) and ImIL-MSNs-PMAA and (b) nanocomposite.
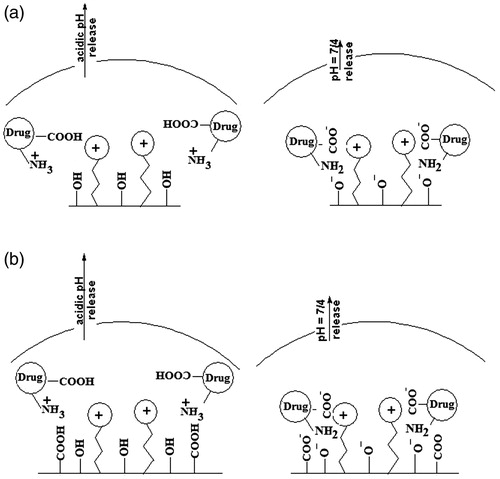
Figure 7. (a) Cumulative release of MTX from ImIL-MSNs and ImIL-MSNs-PMAA under a physiological environment (37°C) and at different pH 4 (a) and 7.4 (b).
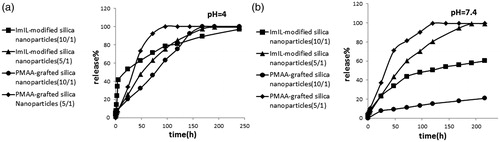
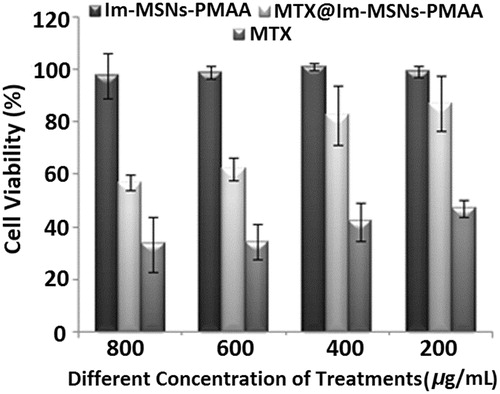
Figure 8. Cell growth inhibition rates by different concentration of drug-free ImIL-MSNs-PMAA nanocomposite, MTX and MTX@ ImIL-MSNs-PMAA nanocomposite.