Figures & data
Figure 1. Procedure for SBA-15 synthesis.
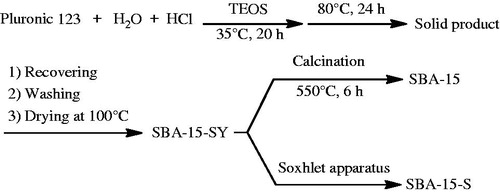
Figure 2. Schematic of amine functionalization of SBA-15.
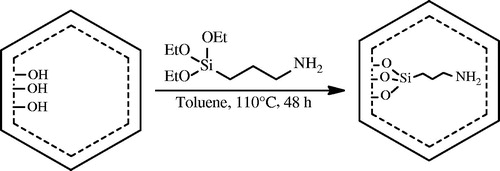
Figure 3. SEM images of soxhlet (A) and calcined (B) SBA-15.
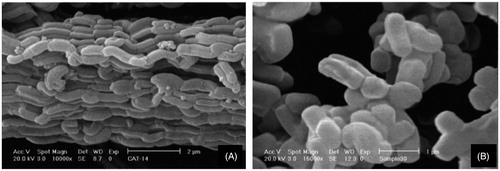
Figure 4. (A) N2 adsorption–desorption isotherms and (B) corresponding BJH pore size distribution curves of pure SBA-15.
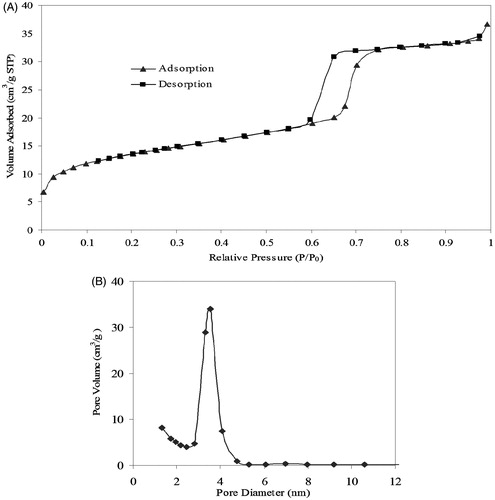
Table 1. Structural parameters of SBA-15.
Figure 5. XRD pattern of SBA-15.
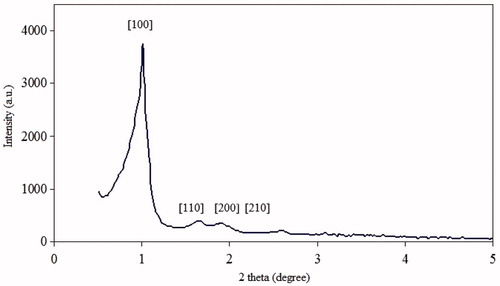
Figure 6. FTIR spectra of SBA-15 before and after calcination, and amine functionalized SBA-15.
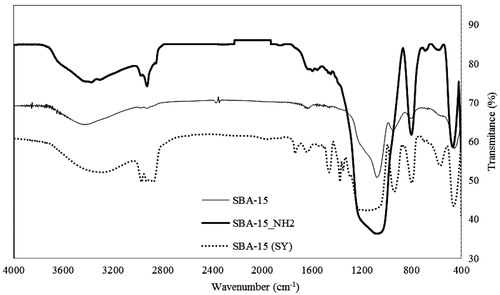
Figure 7. TGA curves of as synthesized, calcined, Soxhlet (2 days), Soxhelt (3 days) SBA-15 (A). DTA and TGA analysis of SBA-15-NH2 (B).
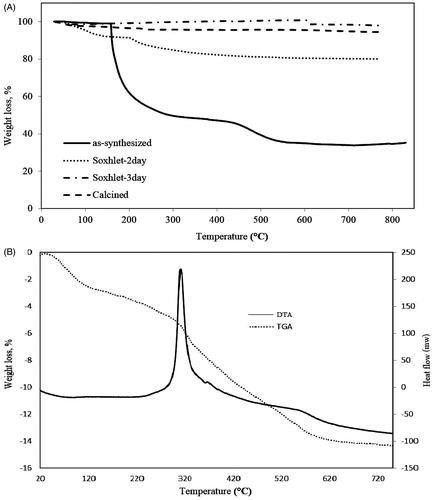
Figure 8. Effect of soaking time on drug loading efficiency while the other conditions were maintained (25 °C, n-hexane solvent).
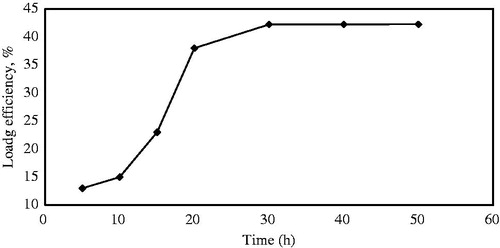
Figure 9. Effect of temperatures on loading efficiencies while the other conditions were maintained (35 h, n-hexane solvent).
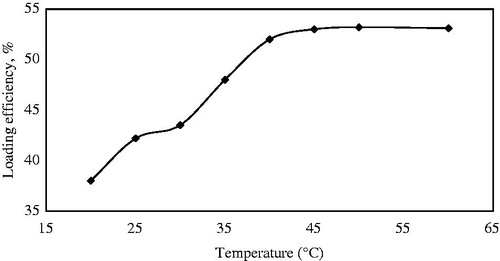
Figure 10. The effect of Ibuprofen/SBA-15 ratio on loading efficiency while the other conditions were maintained (35 h, 40 °C, n-hexane solvent).
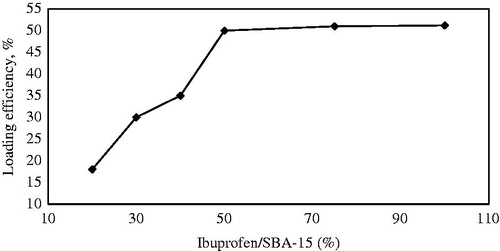
Figure 11. Interaction of Ibuprofen and SBA-15-NH2.
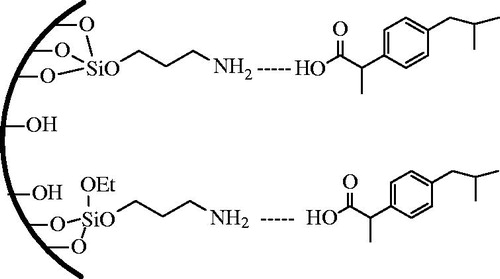
Table 2. Drug loading efficiencies (%) of the synthesized samples.
Figure 12. Cumulative release (CR) % of Ibuprofen from SBA-15-NH2 at different pH in SBF medium.
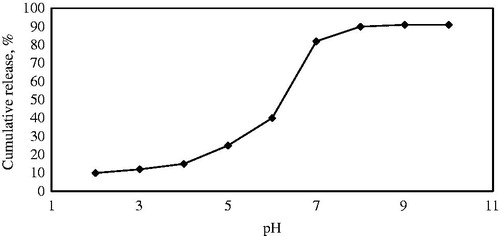
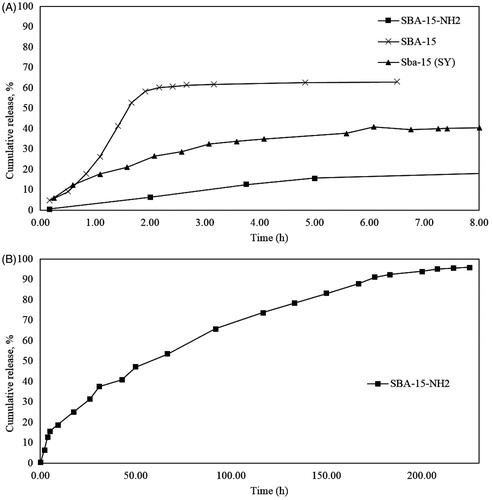
Figure 13. Cumulative release (CR) % of Ibuprofen from (A) SBA-15 (SY), SBA-15 and SBA-15-NH2 untile 8 h, (B) SBA-15-NH2 at 260 h.