Figures & data
Figure 1. The structure of biochanin A.
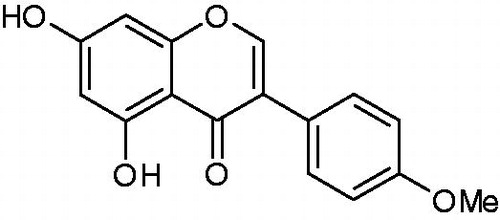
Figure 2. Transmission electron microscopy micrograph of BCA-NLC.
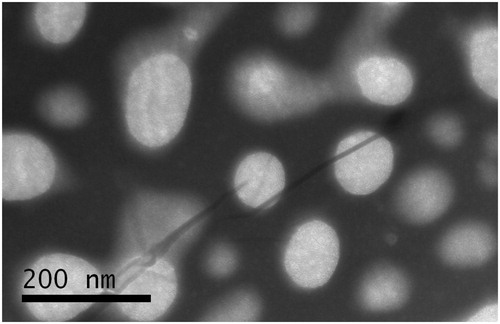
Figure 3. The particle size distribution of BCA-NLC.
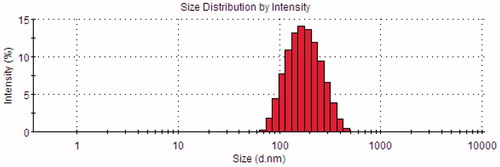
Figure 4. The Differential scanning calorimetry curves: BCA (A), F68 (B), lecithin (C), GMS (D), mannitol (E), physical mixture (F) and lyophilized BCA-NLC (G).
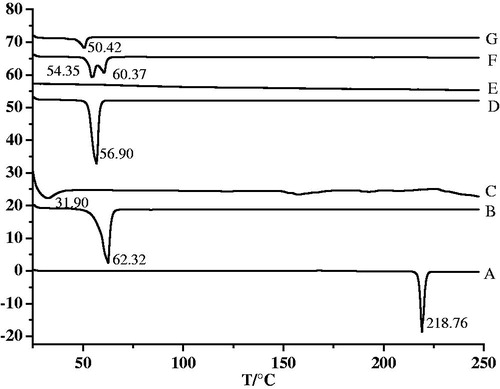
Figure 5. The X-ray diffractions of BCA (A), GMS (B), F68 (C), physical mixture (D) and lyophilized BCA-NLC (E).
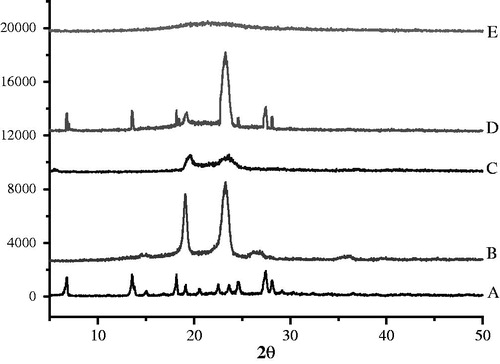
Table 1. The physical stability of BCA-NLC at 4 °C and 25 °C.
Figure 6. In vitro release profiles of BCA from different vehicles. (A) BCA suspension; (B) BCA-NLC.
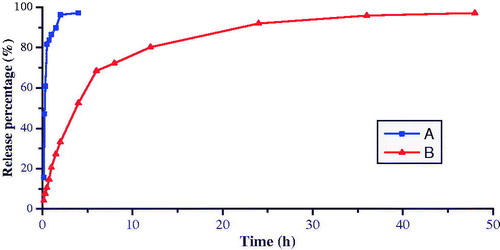
Table 2. The regression equation of BCA released from BCA suspension and BCA-NLC in vitro.
Figure 7. Plasma concentration-time profiles of BCA suspension and BCA-NLC after oral administration in rats. Results are expressed as the mean ± SD of six rats.
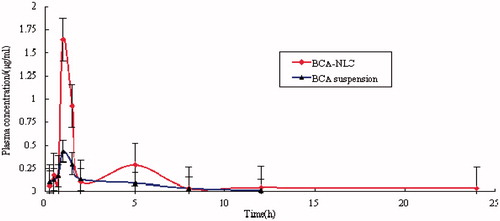
Table 3. The pharmacokinetics parameters of the BCA suspension and BCA-NLC upon oral administration at a dose of 10 mg/kg (n = 6), (mean ± S.D.).