
Figures & data
Table 1. DL and PY of LNCs.
Figure 1. OC plot of LNCs.
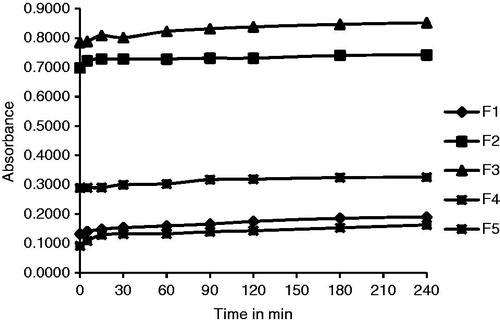
Table 2. SL data of GLB and LNCs.
Figure 2. Dissolution profiles of LNCs compared with GLB. All data points represent the mean value (n = 3).
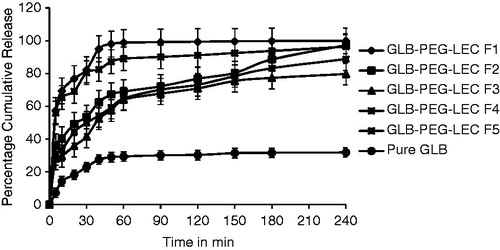
Table 3. Dissolution parameters of GLB and LNCs.
Table 4. Particle size analysis data and ZP report of GLB and LNCs.
Figure 3. (A) X-ray diffraction spectra of GLB, PEG 20000, PM (1:1), and lecithin and (B) LNCs (F1–F5) at 2θ-scale.
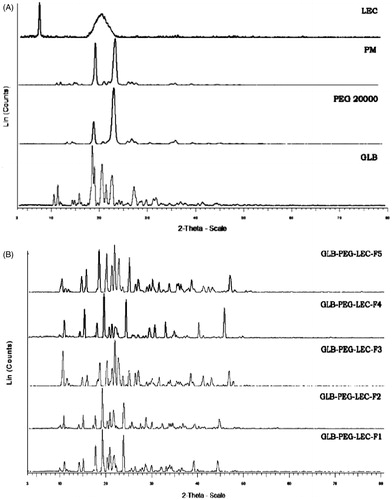
Figure 4. (A) DSC thermograms of GLB, PEG 20000 and PM-1:1 and (B) LNCs.
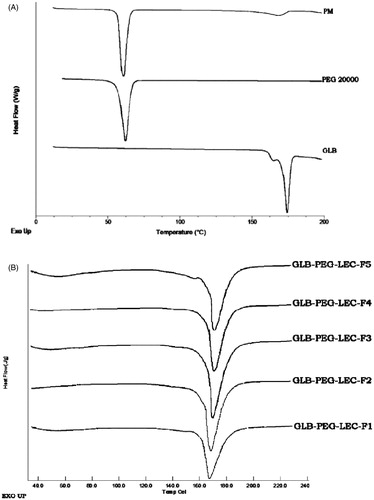
Figure 5. FTIR spectra of GLB, PEG 20000 and PM-1:1 (A) and LNCs (F1–F5) and stabilized formulation (GLB-F1-S-O) after three months of storage.
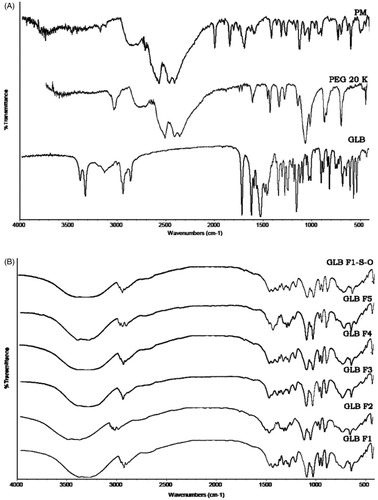
Table 5. Stability analysis data of optimized NC (Batch F1).
Figure 6. (A) SEM images of raw GLB, (B) non complexed F1 NCs, (C) aggregated NCs before complexation and after microscopical examination, (D) complexed F1 LNCs and (E) complexed F1 LNCs dispersed in water and air dried.
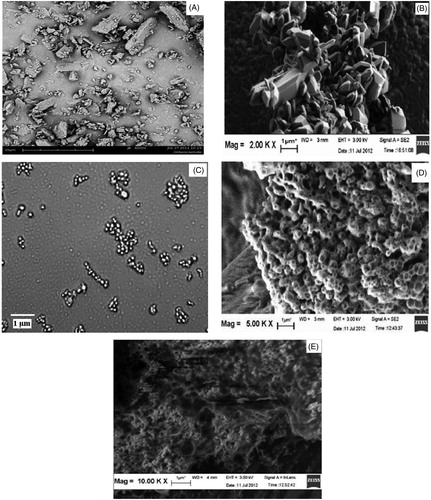
Table 6. RT and peak area of GLB and test sample.