Figures & data
Figure 1. (A) Relationship between intensity at 2θ = 17.78° from XRD of CA and reaction time. (B) Ratio of GO-COO-β-CD to CA.
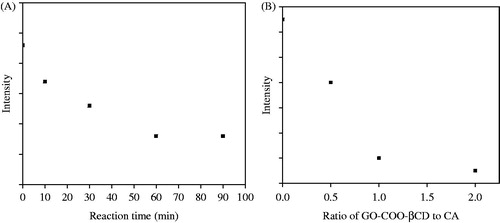
Figure 2. Variation of particle size and PDI of GO-COO-β-CD/CA with temperatures. Inset shows the digital pictures of GO-COO-β-CD/CA aqueous solutions.
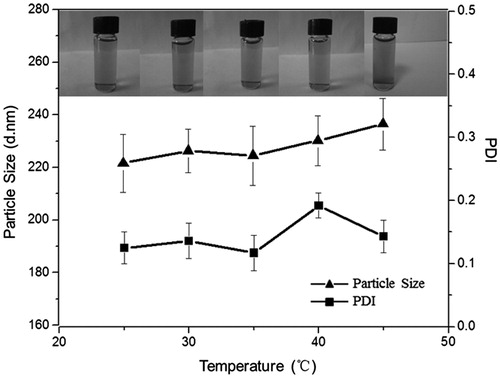
Table 1. Particle size and PDI of GO-COO-β-CD/CA at different temperatures.
Figure 3. (A) Optical images of inhibition zone for GO-COO-β-CD (a), CA (b), GO-COO-β-CD/CA (c) and physical mixture of GO-COO-β-CD and CA (d) against E. coli. (B) Optical images of inhibition zone for GO-COO-β-CD (a), CA (b), GO-COO-β-CD/CA (c) and physical mixture of GO-COO-β-CD and CA (d) against S. aureus.
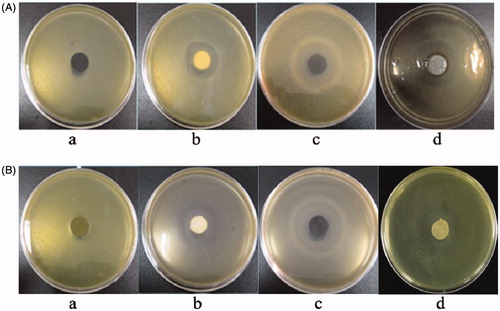
Table 2. Diameter of inhibition zone of GO-COO-β-CD, CA, GO-COO-β-CD/CA and physical mixture of GO-COO-β-CD and CA.
Figure 4. (A) MIC of GO-COO-β-CD (a) and GO-COO-β-CD/CA (b) at different apparent concentrations for E. coli. (B) MIC of GO-COO-β-CD (a) and GO-COO-β-CD/CA and (b) at different apparent concentrations for S. aureus..
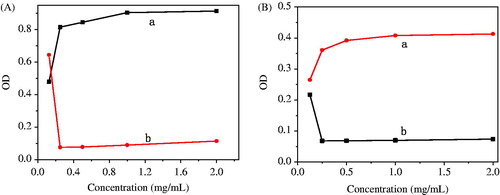
Figure 5. (A) Inhibition curve for E. coli at apparent concentrations of 0 (a), 2 (b), 1 (c), 0.5 (d), 0.25 (e) and 0.125 mg/ml (f). (B) Inhibition curve for S. aureus at apparent concentrations of 0 (a), 2 (b), 1 (c), 0.5 (d), 0.25 (e) and 0.125 mg/ml (f).
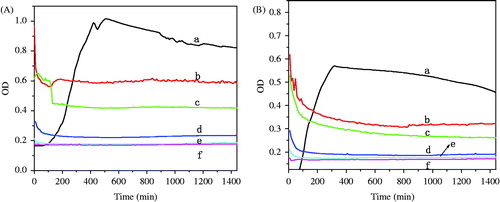
Table 3. Antimicrobial percentage of GO-COO-β-CD/CA for E. coli and S. aureus..
Table 4. Results of hemolysis test of GO-COO-β-CD, CA and GO-COO-β-CD/CA.
Figure 6. Recalcification time of PPP (a), GO-COO-β-CD/CA (b), GO-COO-β-CD (c), CA (d) and PPP+Ca2+ (e).
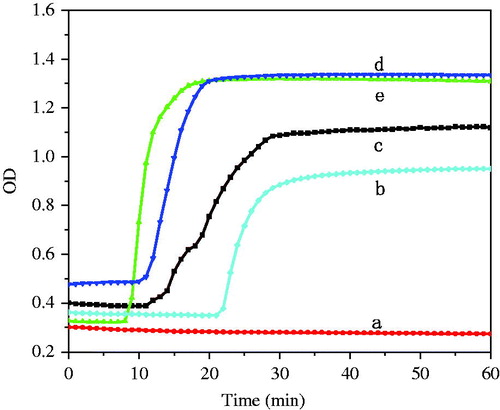
Figure 7. Morphology of HEK 293 cells after culture for 48 h on negative control (a), GO-COO-β-CD (b), CA (c) and GO-COO-β-CD/CA (d).
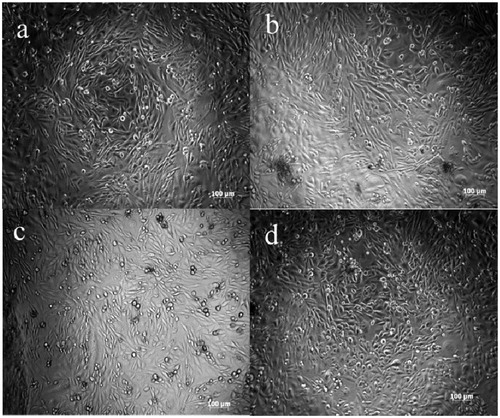
Table 5. Cytotoxicity of GO-COO-β-CD, CA and GO-COO-β-CD/CA.
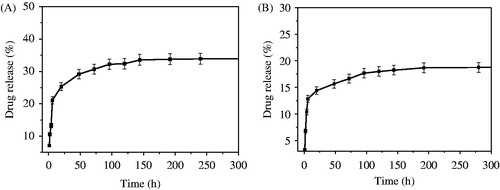
Figure 8. Release profile of GO-COO-β-CD/CA in HCl (pH = 1.0) (A) and PBS (pH = 7.0) (B).