Figures & data
Figure 1. Scanning electron photomicrograph of blank polymeric microspheres of poly (dl-lactide).
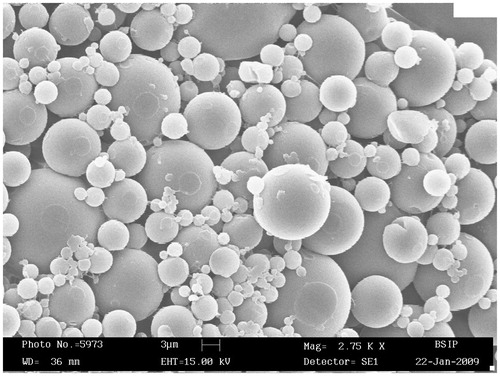
Table 1. Characterization of DL-PLA microspheres bearing BmA and F6 filarial antigen proteins in vitro.
Figure 2. Levels of specific IgG in immunized Swiss mice. Animals were immunized with For sera tail blood of animals were collected on days 7 (A), 21 (B) and 35 (C) post first administration (p.f.a.) of plain or DL-PLA-Ms adsorbed filarial antigens BmA (B. malayi adult extract) or F6 (SDS-PAGE resolved fraction of BmA). Specific IgG antibodies against BmA (1.0 μg protein/ml) or F6 (0.5 μg protein/ml) were determined by sandwich ELISA in serum of the animals immunized with BmA/F6 adsorbed on DL-PLA-Ms and one (A/F6-1D) or two doses (A/F6-2D) of plain BmA/F6 in PBS or PBS alone; absorbance was read at 492 nm. Abbreviation: p.f.i. = post first immunization; A/F6-1D = plain BmA/F6-one dose; A/F6-2D = plain BmA/F6-two doses; PLA-A/F6 = DL-PLA-Ms-BmA/F6. Values are mean ± SD of data from six animals in two experiments. Statistics: Newman–Keuls multiple comparison tests. *p < 0.5 -- significant; **p < 0.1 -- more significant; ***p < 0.001 -- highly significant.
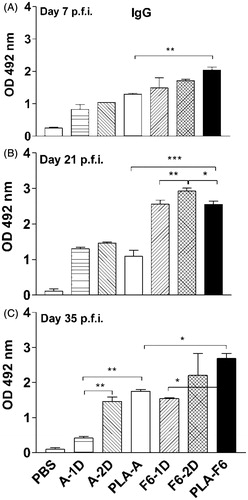
Figure 3. Levels of specific IgG subclasses in immunized Swiss mice. Sera were collected from blood of animals on day 35 p.f.a. of antigens. Specific IgG1 (A), IgG2a (B) and IgG2b (C) antibodies against BmA or F6 were determined by sandwich ELISA in serum of the animals immunized with BmA/F6 adsorbed on DL-PLA-Ms and one (A/F6-1D) or two doses of plain BmA/F6 (A/F6-2D) in PBS or PBS alone; absorbance was read at 492 nm. Values are mean ± SD of data from six animals in two experiments. Group abbreviations: A/F6-1D = plain BmA/F6- one dose; A/F6-2D = plain BmA/F6- two doses; PLA-A/F6 = DL-PLA-Ms-BmA/F6. Statistics were same as described above. p < 0.01. ***p < 0.001.
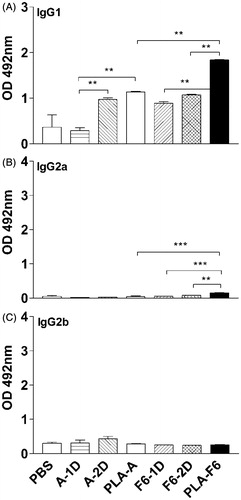
Figure 4. Proliferative responses (cpm) of splenocytes of animals immunized with one dose of BmA/F6 adsorbed on DL-PLA-Ms or one or two doses of plain BmA/F6 of B. malayi or PBS alone. The cells were unstimulated (A) stimulated with BmA/F6 at 1.0/0.5 µg/ml, respectively (B) and Con A at 10 µg/ml (C) in vitro. Values are mean ± SD of data of two experiments using six animals. All the animals were killed on day 35 p.f.a. of plain antigens or DL-PLA-Ms adsorbed antigens or PBS alone. Group abbreviations and statistics were same as described above. *p < 0.5 -- significant; **p < 0.1 -- more significant; ***p < 0.001 -- highly significant.
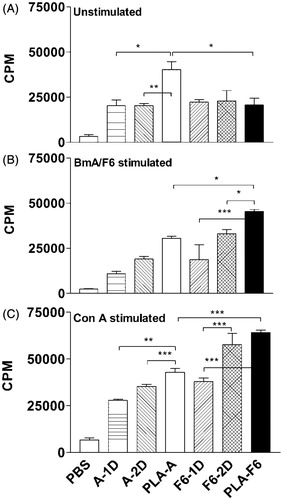
Figure 5. IFN-γ release from splenocytes of immunized Swiss mice. The animals were immunized with one dose of BmA/F6 adsorbed on DL-PLA-Ms or one or two doses of plain BmA/F6 of B. malayi or PBS alone. The animals were killed on day 35 p.f.a. of plain antigens or DL-PLA-Ms adsorbed antigens or PBS alone. The cells were unstimulated (A), stimulated with BmA/F6 at 1.0/0.5 µg/ml, (B) or LPS at 1.0 µg/mL in vitro. IFN-γ release in 48 h culture supernatants was determined by ELISA. Values are expressed in mean ± SD of data from six animals. Group abbreviations and Statistics were same as described above. ***p < 0.001.
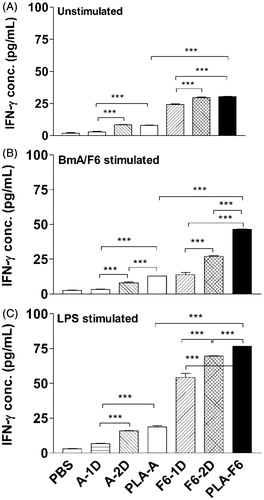
Figure 6. TNF-α release from splenocytes of immunized Swiss mice. The animals were immunized with one dose of F6 adsorbed on DL-PLA-Ms or one or two doses of plain F6 of B. malayi or PBS alone. The animals were killed on day 35 p.f.a. of plain antigens or DL-PLA-Ms adsorbed antigens or PBS alone. The cells were unstimulated (A), stimulated with F6 at 0.5 µg/ml, (B) or LPS at 1.0 µg/ml in vitro. TNF-α release in 48 h culture supernatants was determined by ELISA. Values are expressed in mean ± SD of data from six animals. Group abbreviations and statistics were same as described above. ***p < 0.001.
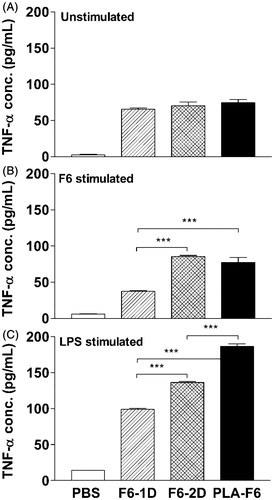
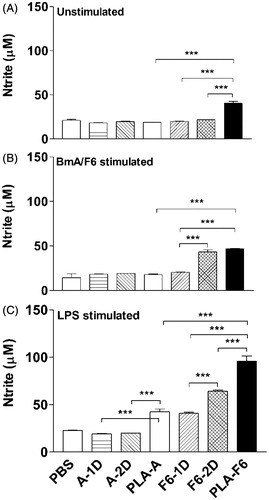
Figure 7. Nitric oxide release from peritoneal macrophages of immunized Swiss mice. The animals were immunized with one dose of F6 adsorbed on DL-PLA-Ms or one or two doses of plain F6 of B. malayi or PBS alone. The animals were killed on day 35 p.f.a. of plain antigens or DL-PLA-Ms adsorbed antigens or PBS alone. The cells were unstimulated (A), stimulated with BmA/F6 at 1.0/0.5 µg/ml, (B) or LPS at 1.0 µg/ml (C) in vitro. NO release in 48 h culture supernatants was determined by Griess reagent. Values are expressed in mean ± SD of data from six animals. Group abbreviations and statistics were same as described above. ***p < 0.001.