Figures & data
Figure 1. IR spectrum of D, L-lactide (a), MPEG2000 (b), the physical mixture of lactide and MPEG2000 (c) and the diblock copolymer MPEG-PDLLA (d).
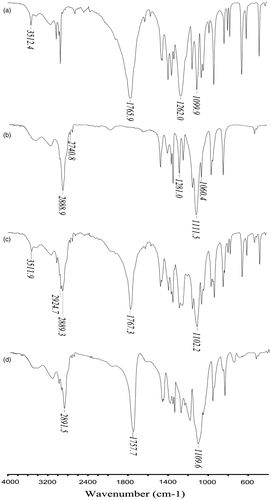
Figure 2. 1H NMR spectrum of mPEG-PDLLA (50:50).
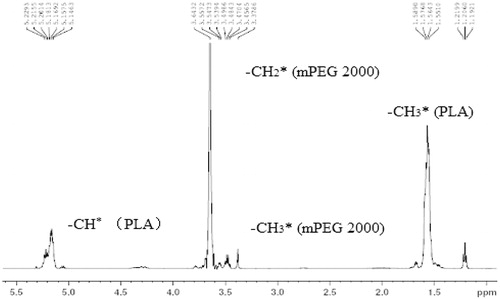
Table 1. Molecular weight and molecular weight distribution of mPEG-PDLLA.
Figure 3. Gel permeation chromatograms of mPEG-PDLLA.
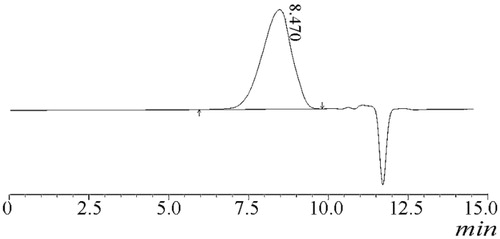
Figure 4. Size distribution of arginine-dispersed DTX-PM measured by DLS (a) and Atom Force Microscopy (AFM) of the DTX-PM (b).
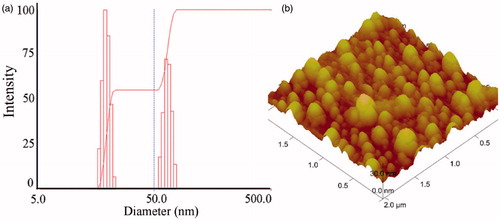
Table 2. Characteristics of dispersed DTX-PM in deionized water or arginine (2.0 mg/ml).
Figure 5. In vitro release profile of DTX from AR-DTX-PM and Glu-DTX-PM in PBS7.4 (0.5% of Tween80 and 5% bovine serum) at 37 °C (n = 3).
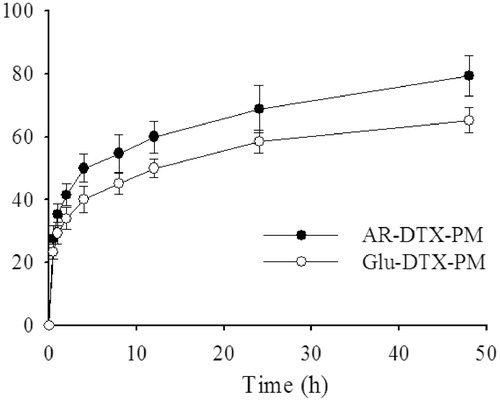
Figure 6. The change of diameter of arginine-dispersed DTX-PM and 5% glucose-dispersed DTX-PM diluted with 5% glucose.
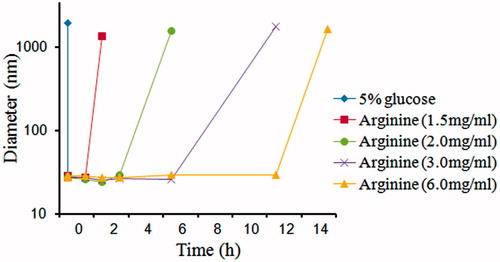
Figure 7. HPLC chromatogram of alkaline degradation of DTX.
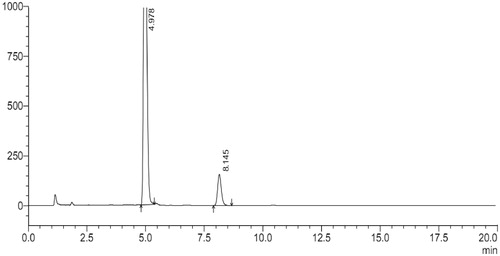
Table 3. PH value of dispersed DTX-PM in arginine of different concentrations and diluted with either 5% glucose or 0.9% NaCl*.
Table 4. Single impurity content (S) and total impurity content (T) of 5% glucose dilution of DTX-PM dispersed in arginine (AR) with a series concentration of 1.5, 3.0, 6.0 mg/ml, respectively.*.
Figure 8. Pyrene excitation spectra of mPEG-PDLLA aqueous solutions (emission wavelength at 390 nm).
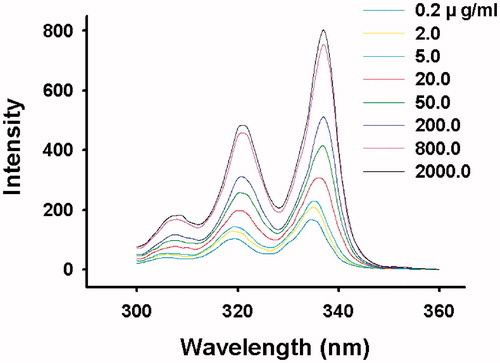
Figure 9. Intensity ratio of I337/I334 versus logC for mPEG-PDLLA (50/50) in (a) water, (b) 2 mgċml–1 arginine solution, (c) 4 mgċml–1 arginine solution and (d) 8 mgċml–1 arginine solution.
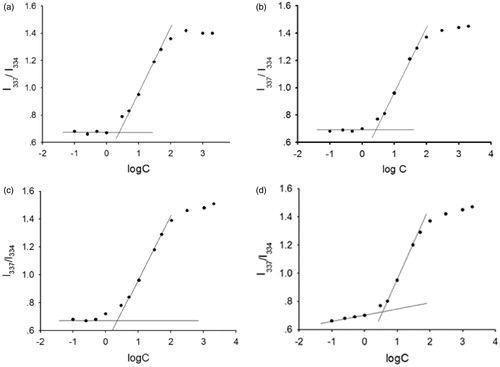
Table 5. CMC value of mPEG-PDLLA in arginine solution of different concentration (n = 5, ).
).
Table 6. The stabilizing time of DTX-PM dispersed with different solutions.
Figure 10. The electrostatic interaction and hydrogen bond formation between arginine and the taxanes.
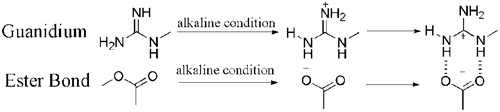
Figure 11. Variation of body weight in beagle dogs time curves. The results are shown as the means ± SD (n = 4).
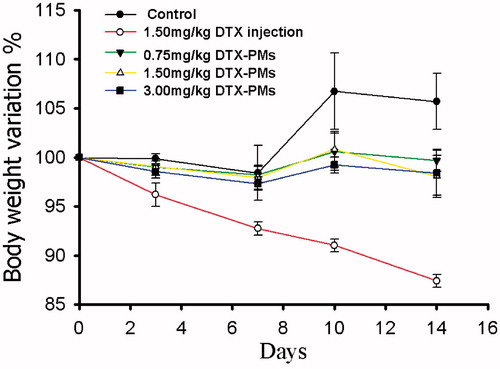
Figure 12. The variation of white blood cells (WBC, a), neutrophil % (Neut, b), platelets (PLT, c), red blood cells (RBC, d) and hemoglobin (HEG, e) during the observation (n = 4).
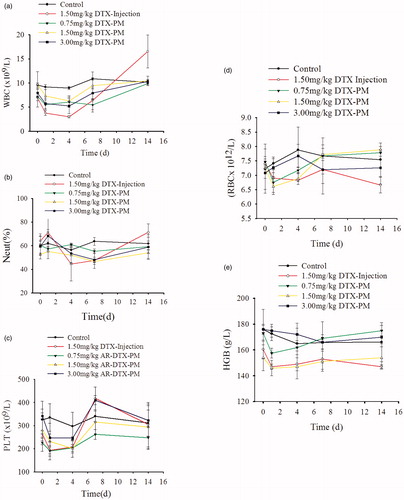
Figure 13. The plasma concentration time curves of DTX from DTX-PM and DTX injection. The results are shown as the means ± SD (n = 6).
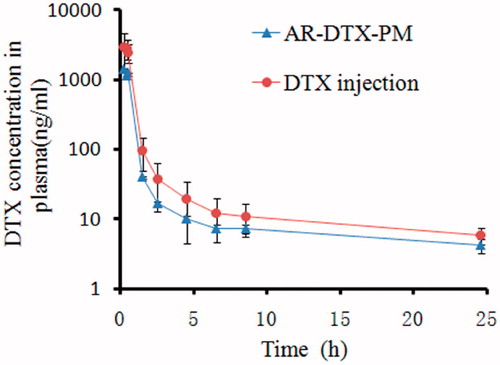
Table 7. The pharmacokinetic parameters of DTX for DTX injection and DTX-PM.
Figure 14. The antitumor efficacy against mice bearing S180. (a) The relative tumor volume-time curve; (b) the survival rate change; (b) the body weight change. The results are shown as means ± SD (n = 7).
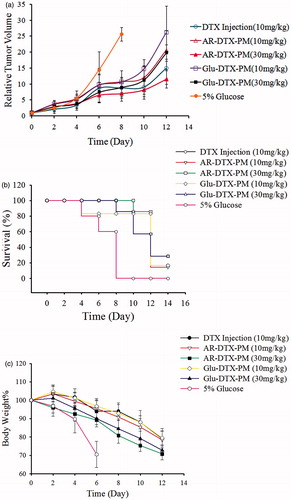
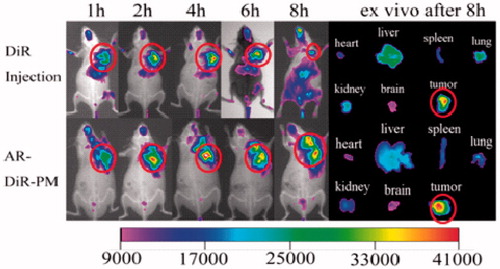
Figure 15. In vivo infrared (NIR) optical imaging of DiR injection and AR-DTX-PM at different time point on S180 allograft tumor in SPF mice, and ex vivo images of dissected tissues after 8 h.