
Figures & data
Figure 1. Chemical structure of WG.
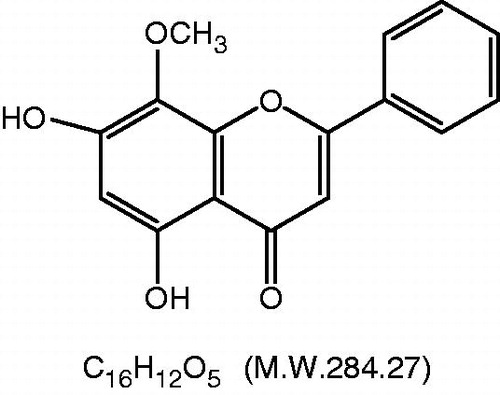
Figure 2. Transmission electron photomicrographs of WG liposomes. (A) WG liposome with no surface decoration (WG-Lip) and (B) GA-modified WG liposome (GA-WG-Lip).
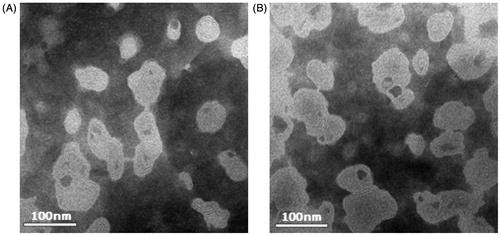
Table 1. The particle size and Zeta potential of the liposomes (n = 3, ± SD).
Figure 3. Cellular uptake of WG preparations in L02, LX2 and HepG2 cells. Each group was contain 400 µg ml−1 of WG, which was parallely incubated for 2 h. Each data represent the mean ± SD (n = 3). *Significant difference between the WG solution and WG liposomes in the groups of L-02 and HepG2 (p < 0.05). ΔSignificant difference between groups of L-02 and HepG2 with the treatment of WG-Lip and GA-WG-Lip (p < 0.05).
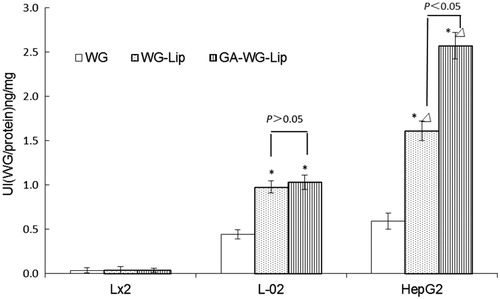
Figure 4. Inhibitory effects of WG preparations on the proliferation of HepG2 cells over 24 h. *p < 0.01, compared with WG solution in each corresponding group; Δp < 0.01, compared with the WG-Lip group in each corresponding group. Each data represent the mean ± SD (n = 3).
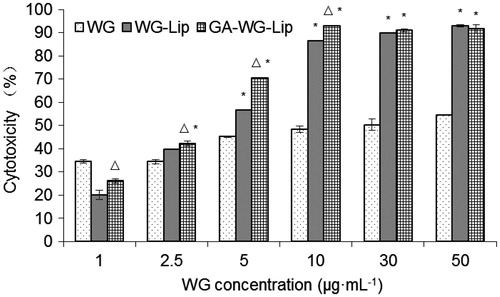
Figure 5. Concentrations of WG in mouse tissues at different times following a single intravenous dose (20 mg kg−1). (A–C) Represent 15 min, 90 min and 180 min, respectively. Each data represent the mean ± SD (n = 3).
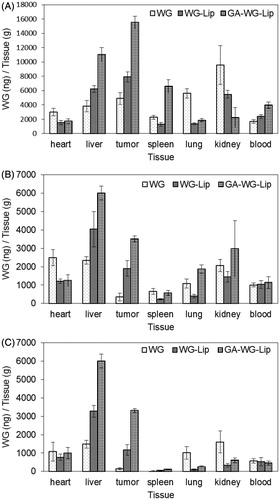
Table 2. The effect of WG-Lip and GA-WG-Lip on tumor model of Heps in mice (n = 10, ± SD).