Figures & data
Table 1. Variables in Box–Behnken design.
Table 2. Parameters used for spreadability determination of gel.
Table 3. Different animal groups for in vivo study.
Table 4. Observed responses for BPO-loaded niosomes (Box–Behnken design).
Table 5. Summary of results of regression analysis for responses Y1, for fitting to quadratic model.
Table 6. Summary of results of regression analysis for responses Y2, for fitting to quadratic model.
Figure 1. Contour plots showing the interaction effect. (Blue region is small size region.).
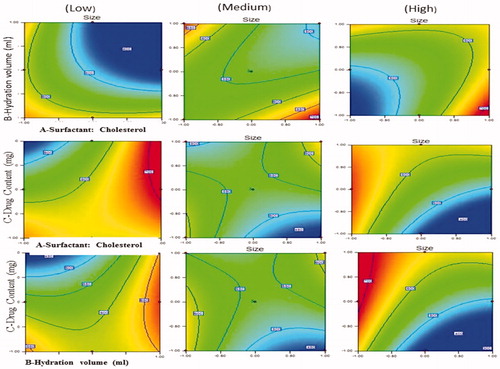
Figure 2. Response surface plot showing effect of interaction between surfactant:cholesterol ratio (A) and hydration volume (B) with low level of drug content (C) on response (size).
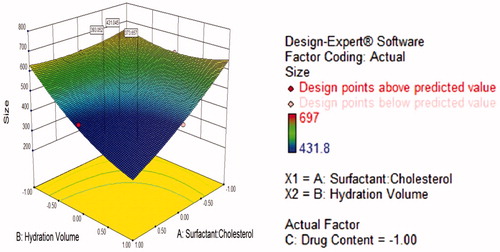
Figure 3. Response surface plot showing effect of surfactant:cholesterol (A) and drug content (C) interaction with high level of hydration volume (B) on response (size).
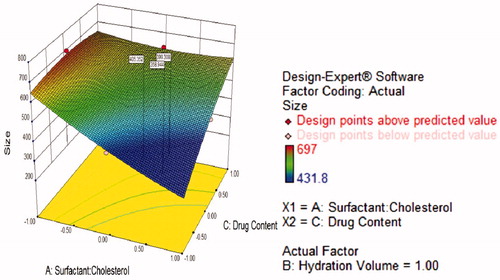
Figure 4. Response surface plot showing effect of hydration volume (B) and drug content (C) interaction with high level surfactant:cholesterol (A) of on response (size).
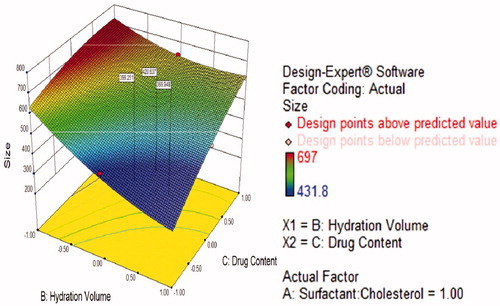
Figure 5. Contour plots showing the interaction effect for entrapment efficiency (orange yellow region shows more entrapment efficiency).
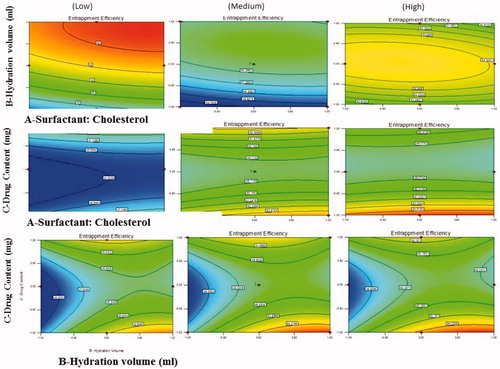
Figure 6. Response surface plot showing effect of interaction between surfactant:cholesterol ratio (A) and hydration volume (B) with low level of drug content (C) on response (entrapment efficiency).
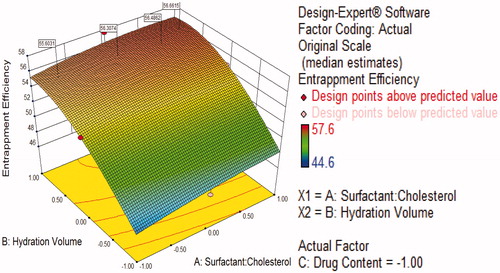
Figure 7. Response surface plot showing effect of interaction between surfactant:cholesterol ratio (A) and drug content (C) with high level of hydration volume (B) on response (entrapment efficiency).
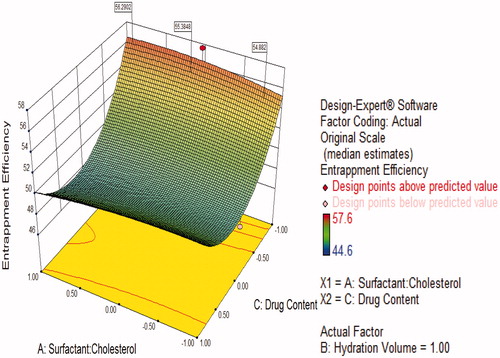
Figure 8. Response surface plot showing effect of interaction between hydration volume (B) and drug content (C) with high level of surfactant:cholesterol ratio (A) on response (entrapment efficiency).
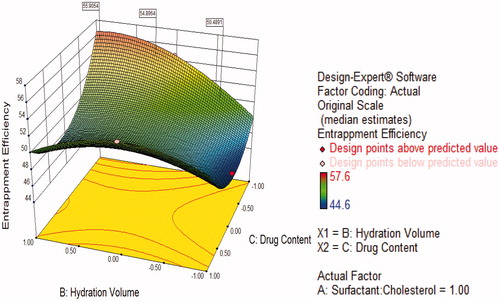
Table 7. Composition of checkpoint formulations, expected and observed value for response variable of niosomal size.
Figure 9. (a) Noisome image under motic digital microscope and (b) TEM image.
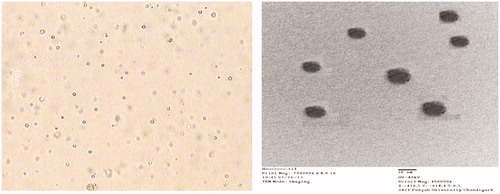
Figure 10. Size and size distribution of optimized niosomes.
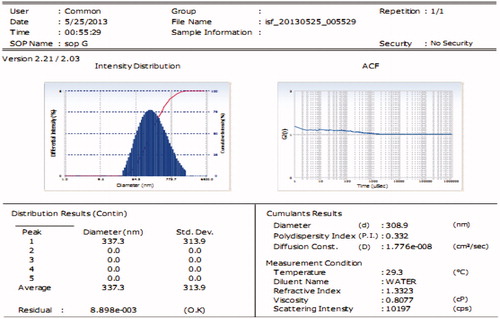
Figure 11. Zeta potential of noisome.
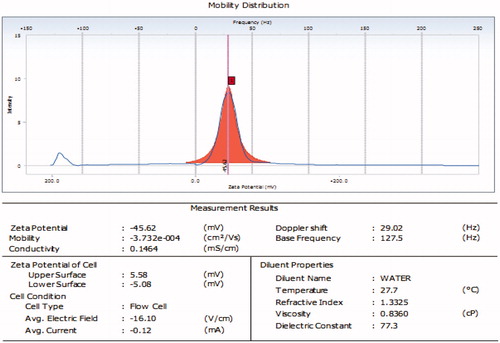
Figure 12. In vitro drug release profile of noisome.
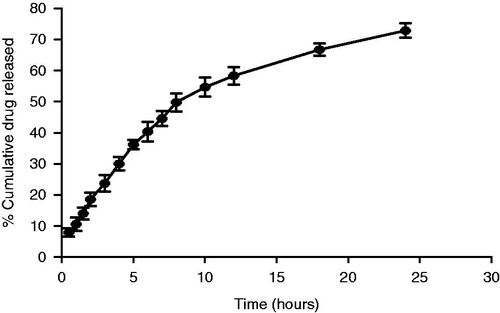
Figure 13. Viscosity profile of niosome gel.
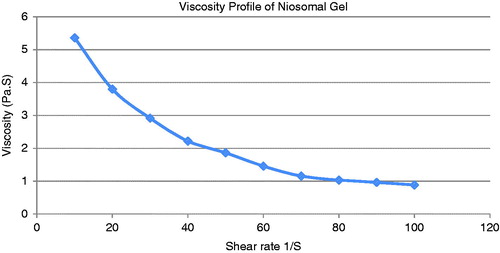
Figure 14. In vitro drug release of NG.
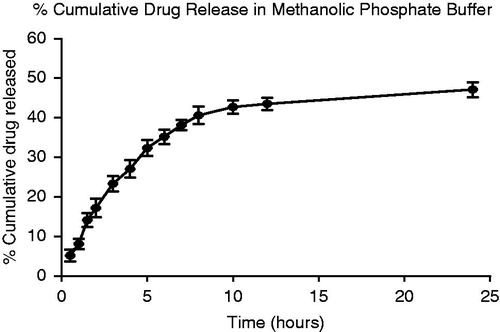
Figure 15. In vitro permeation of niosomal and plain gel.
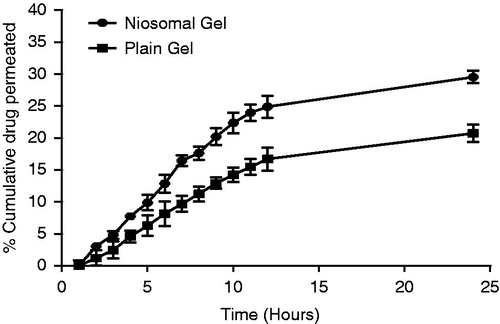
Table 8. Skin permeation and retention study of NG.
Table 9. MIC of BPO.
Table 10. Zone of inhibition against S. aureus.
Table 11. Zone of inhibition of formulations against P. acnes equivalent drug (µg).
Figure 16. Percentage inhibition of inflammation by test formulations.
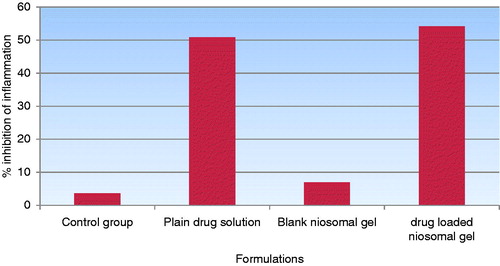
Table 12. % inhibition of inflammation after epicutaneous application of formulation.
Figure 17. (a) Mice ear after P. acnes injection (b) mice ear after four days treatment with NG.
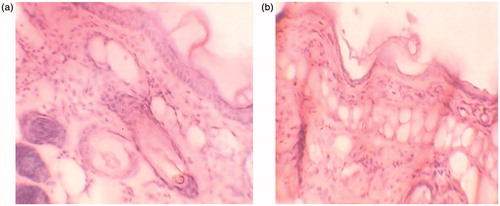
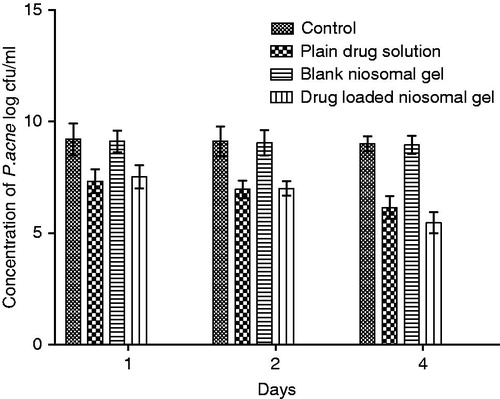
Figure 18. Log CFU count of P. acnes after epicutaneous application of test formulations.