Figures & data
Table 1. Levels and factors in the orthogonal design.
Table 2. The test of orthogonal design for optimization of OP liposome formulation.
Table 3. Results of the orthogonal design of OP liposomes.
Table 4. The entrapment efficiency of liposomes (n = 3).
Figure 1. TEM image of blank liposomes.
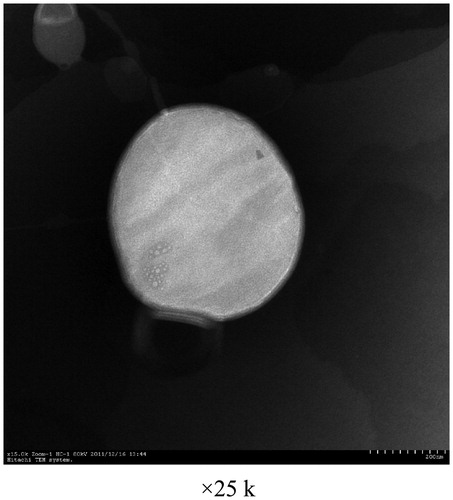
Figure 2. TEM image of OP liposomes.
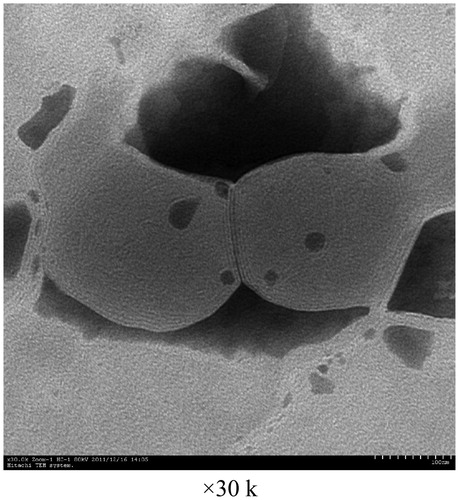
Figure 3. AFM image of blank liposomes.
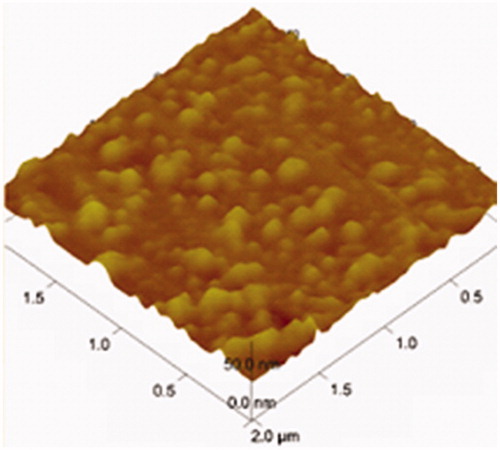
Figure 4. AFM image of OP liposomes.
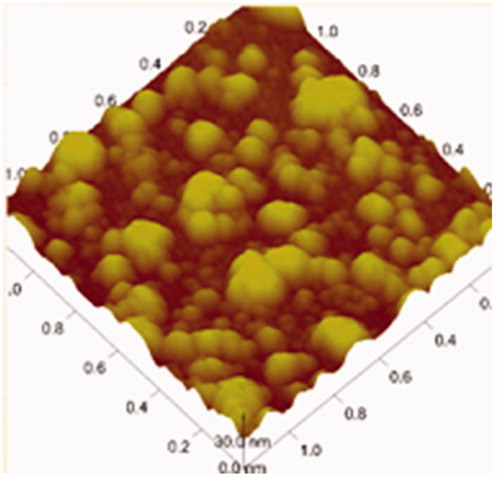
Table 5. Particle size, polydispersity index and zeta potential of OP liposomes.
Table 6. The physical and chemical properties of liposomal OP dry powders as different ratio of l-leucine and solid content liposome.
Figure 5. SEM images liposomal OP dry powders.
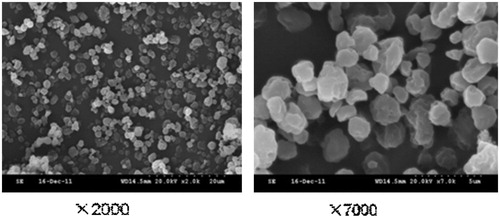
Table 7. Properties of optimized liposomal OP dry powders formulation.
Table 8. The solution of liposomes before and after spray-dried at 4 °C.
Table 9. Drug content uniformity of liposomal OP dry powders.
Figure 6. X-ray diffraction spectrum of OP.
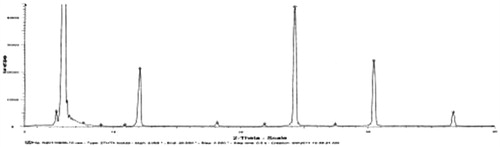
Figure 7. X-ray diffraction spectrum of L-Lecuine.
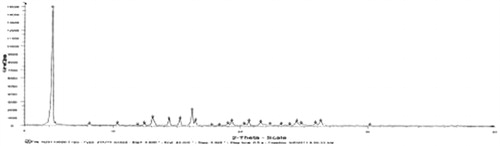
Figure 8. X-ray diffraction spectrum of liposomal OP dry powders.
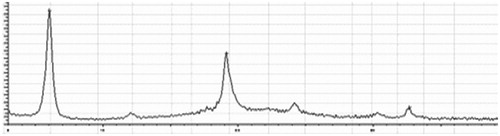
Figure 9. TEM image of blank liposomal dry powders.
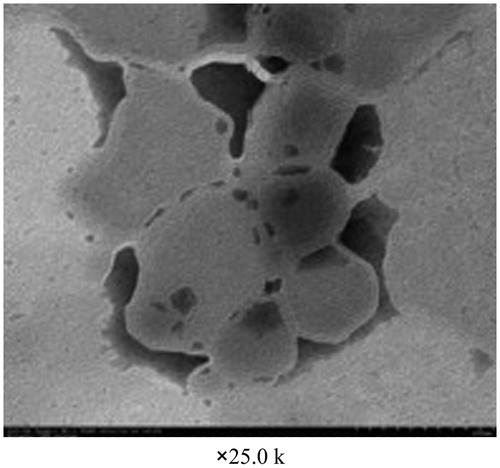
Figure 10. TEM image of liposomal OP dry powders.
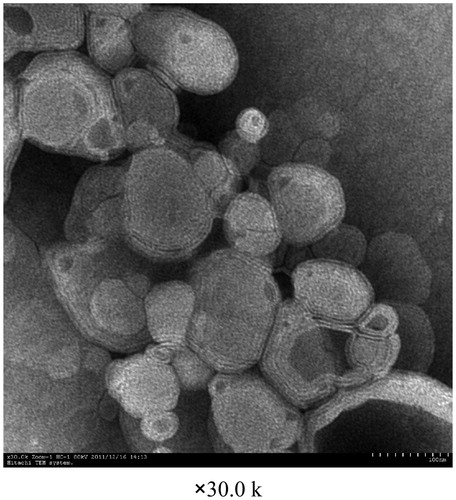
Figure 11. AFM image of blank liposomal dry powders.
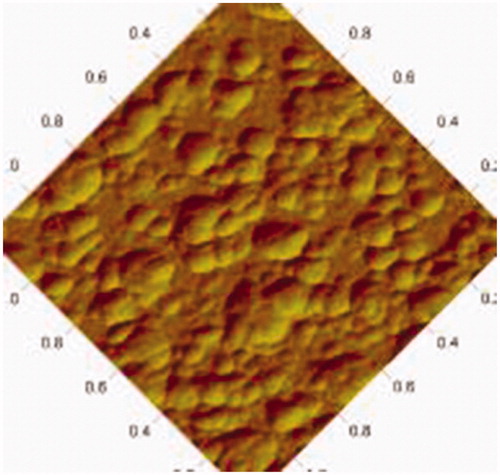
Figure 12. AFM image of OP liposomal dry powders.
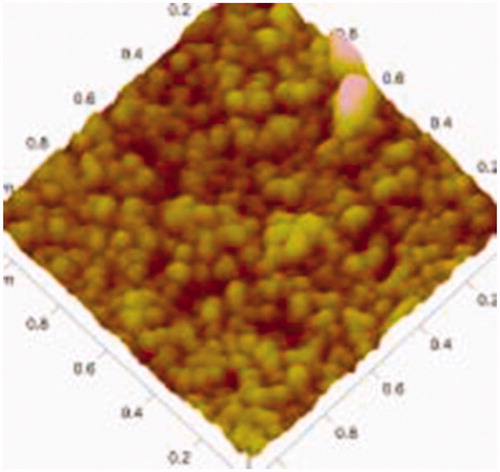
Figure 13. The curve of drug cumulative release percentage over time for different preparations.
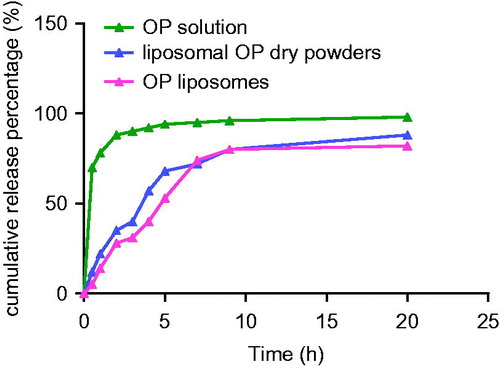
Figure 14. Chromatography of OP in liver homogenates (A) and lung homogenates (B).
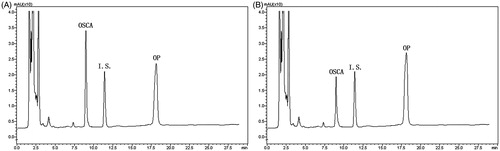
Figure 15. Regression line of v and v/[s] of liver homogenates and lung homogenates.
![Figure 15. Regression line of v and v/[s] of liver homogenates and lung homogenates.](/cms/asset/7f74516d-8d6d-4822-8f7b-d20665dc0eb6/idrd_a_863526_f0015_b.jpg)
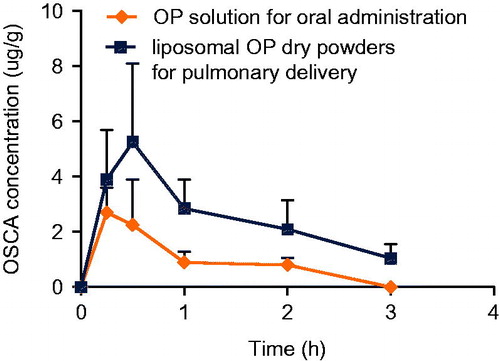
Figure 16. OSCA plasma concentration-time profile of group a (OP solution for oral administration) and group b (liposomal OP dry powders for pulmonary delivery).
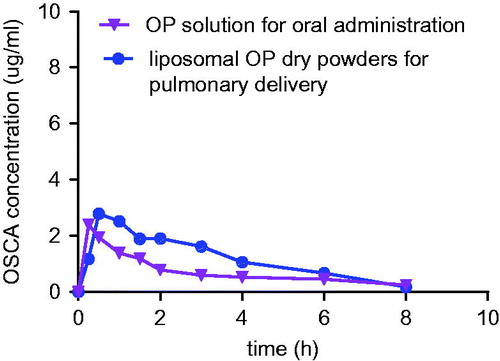
Table 10. Pharmacokinetic analysis of OSCA following different administration (n = 5).
Figure 17. OSCA concentrations in the lung of group c (OP solution for oral administration) and group d (liposomal OP dry powders for pulmonary delivery).