Figures & data
Table 1. Composition of the CCS films.
Table 2. Evaluation of trials (mean ± SD, n = 3).
Figure 1. Release profiles of Cu B from CCS-films prepared by trial 1, trial 2, trial 3 and trial 4 (n = 6, mean ± SD).
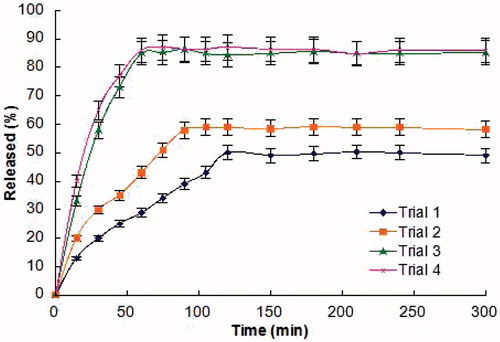
Figure 2. SEM micrographs of the final formulation. The images of the peripheral and middle regions are represented on the left and right side, respectively.
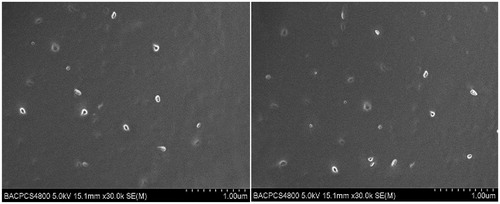
Figure 3. Transmission electron micrographs of Cu B-PL/SDC-MMs. The images of the initial MMs solution and reconstituted MMs solution are represented on the left and right side, respectively (scale bar = 100 nm).
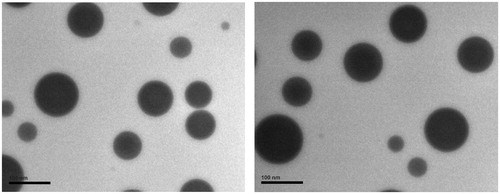
Table 3. MMs sizes and EE of the initial MMs solution and reconstituted MMs solution (mean ± SD, n = 3).
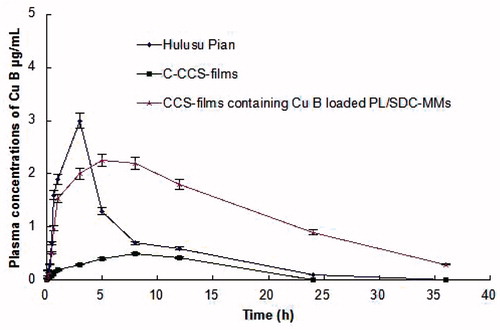
Figure 4. Plasma concentration-time profile of Cu B in rabbits after administration of 1 mg/kg Cu B in different formulations. Each point represents the mean ± SD of five experiments.