Figures & data
Table 1. The entrapment efficiency and particle size of transfersomes under different preparation degree.
Table 2. The entrapment efficiency of transfersomes containing different kinds of surfactants.
Figure 1. (A) Accumulative amount of drug permeated in 12 h under different pH of the PBS buffer and (B) the amount of drug remained in the skin under different pH of the PBS buffer. Data represents mean with standard deviation at n = 3.
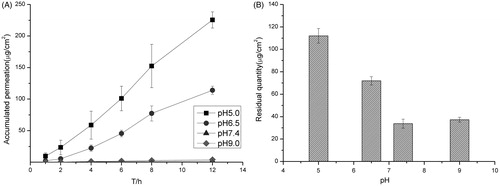
Figure 2. (A) Accumulative amount of drug permeated in 12 h under different drug loading and (B) the amount of drug remained in the skin under different drug loading. Data represents mean with standard deviation at n = 3.
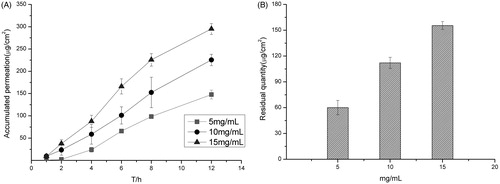
Figure 3. (A) Accumulative amount of drug permeated in 12 h under different surfactants and (B) the amount of drug remained in the skin under different surfactants. Data represents mean with standard deviation at n = 3.
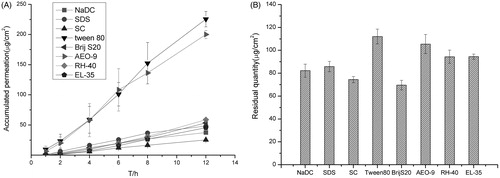
Table 3. The entrapment efficiency and particle size of transfersomes containing different amount of drug.
Table 4. The optimized formulation of terbinafine hydrochloride transforsomes.
Figure 4. (A) Accumulative amount of drug permeated in 12 h and (B) the amount of drug remained in the skin of the transfersomes gel and the Lamisil cream. Data represents mean with standard deviation at n = 3.
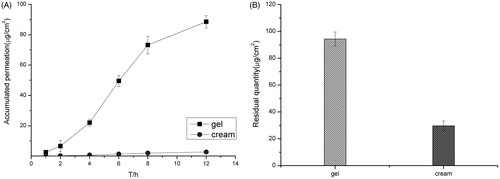
Table 5. The stability of the transfersomes gel in one month.
Table 6. The in vitro relative recovery of the probe.
Figure 5. (A) In vivo recovery of the probe in reverse dialysis during 10 h and (B) the drug concentration-time curves of the transfersomes gel and the Lamisil cream. Data represents mean with standard deviation at n = 3.
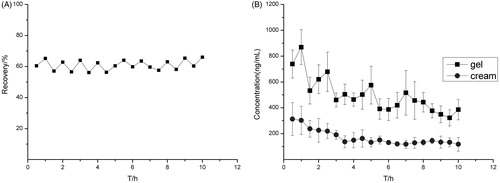
Table 7. The pharmacokinetic parameters.
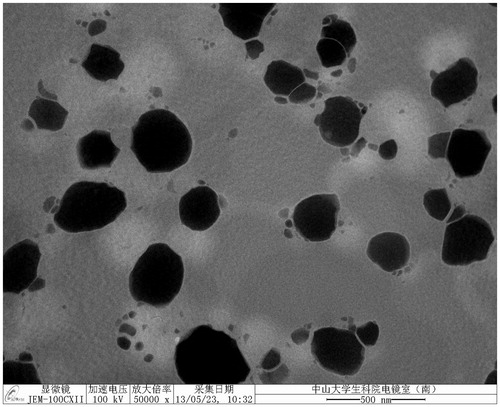
Figure 6. Electron microscopy figure of terbinafine transfersomes (× 50 000).