Figures & data
Table 1. Dissolution data of immediate release SSM aceclofenac capsule formulations in pH 6.8 buffer.
Table 2. Effect of excipients on Gelucire 44/14 based formulation (F18).
Table 3. Dissolution data of aceclofenac sustained release SSM capsules.
Table 4. Semiquantitative solubility of Aceclofenac in different bases.
Figure 1. Release profiles of aceclofenac and marketed tablets in different pH. D-plain drug, MT – immediate release marketed tablets. Each value represents mean ± SD (n = 6). Only positive SD bar is displayed for clarity.
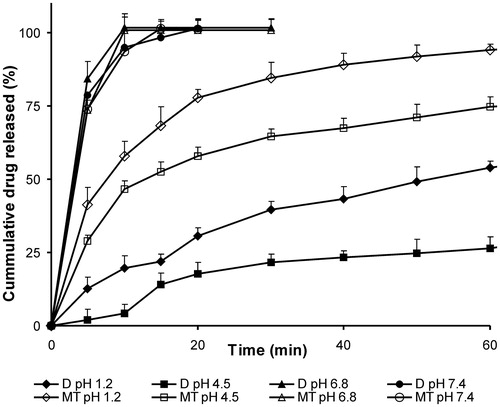
Table 5. Comparative studies of immediate release formulations in different media.
Figure 2. Release profiles in pH 6.8 of drug:different SSM carriers (1:5). MT – immediate release marketed tablets, G – Gelucire. Each value represents mean ± SD (n = 6). Only positive SD bar is displayed for clarity.
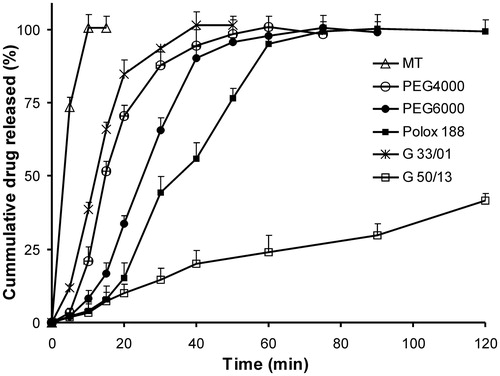
Figure 3. Release profile of Gelucire 44/14-based SSM at different ratios in pH 6.8. MT – immediate release marketed tablets. Each value represents mean ± SD (n = 6). Only positive SD bar is displayed for clarity.
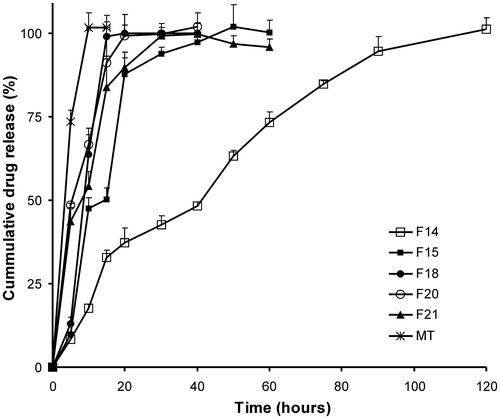
Figure 4. Effect of excipients on dissolution profile of Gelucire 44/14-based SSM (F18) in pH 6.8. MT – immediate release marketed tablets. Each value represents mean ± SD (n = 6). Only positive SD bar is displayed for clarity.
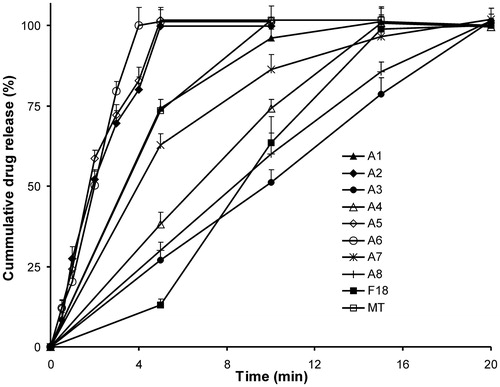
Figure 5. Dissolution profiles of sustained release Gelucires 50/13- and 43/01-based SSM formulations. MT – sustained release marketed tablets. Each value represents mean ± SD (n = 6). Only positive SD bar is displayed for clarity.
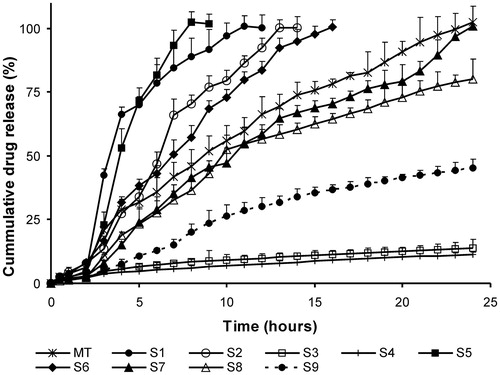
Figure 6. Dissolution profiles of sustained release Gelucires 43/01- and 44/14-based SSM formulations. MT – sustained release marketed tablets. Each value represents mean ± SD (n = 6). Only positive SD bar is displayed for clarity.
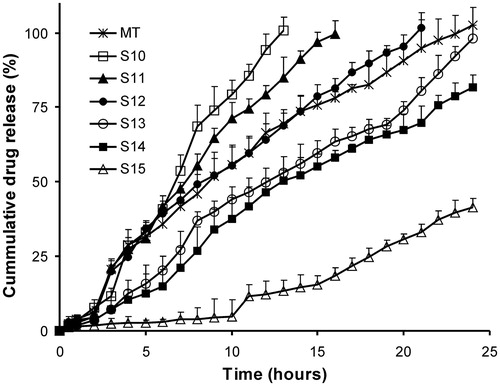
Table 6. Kinetic data of sustained release SSM capsules.
Figure 7. DSC scans of Gelucire-based immediate release SSM formulations. (a) Aceclofenac, (b) dummy A3 (Gelucire 44/14 +docusate sodium), (c) dummy A7 (Gelucire 44/14 + Tween 80) and (d) A3, (e) A7.
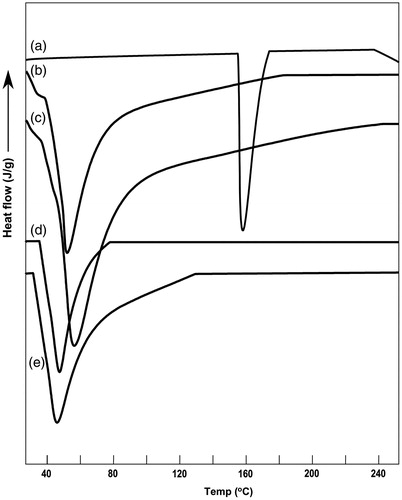
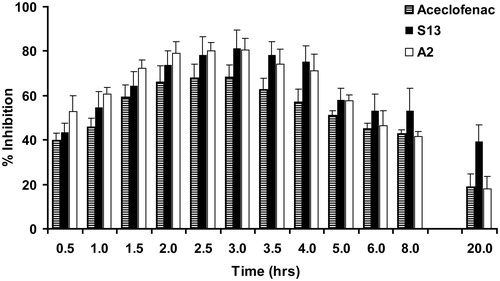
Figure 8. Percent inhibition by aceclofenac SSM formulations on carrageenan-induced rat paw edema. Each value represents mean ± SD (n = 6). Only positive SD bar is displayed for clarity.