Figures & data
Table 1. Independent factors and observed values of the dependent factors (responses) (n = 3).
Figure 1. Particle size (Zetasizer image) of optimized NPs and their TEM image.
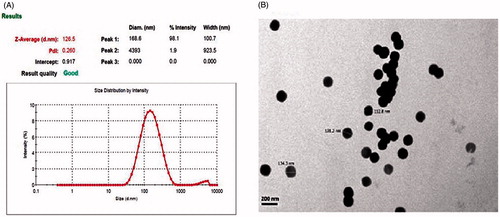
Figure 2. SEM image of developed PLGA-NPs.
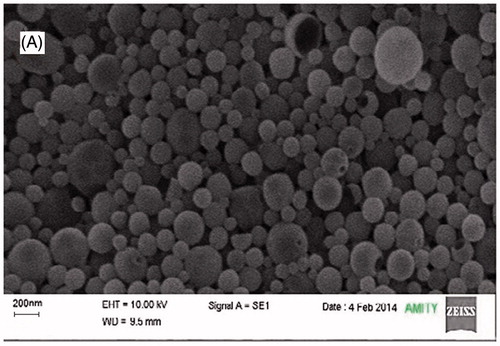
Figure 3. Effects of polymer concentration, stabilizer concentration, and homogenization cycle on particle size.
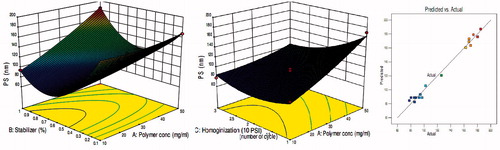
Figure 4. Effects of polymer concentration, stabilizer concentration, and homogenization cycle on entrapment efficiency.
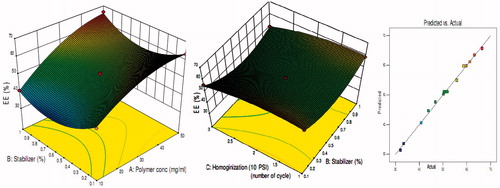
Figure 5. Effects of polymer concentration, stabilizer concentration, and homogenization cycle on loading capacity.
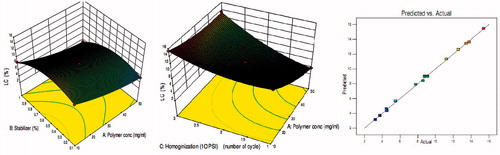
Table 2. Level of independent and dependent variables used in experiments.
Table 3. Final optimization formula for PLGA NPs from point prediction (n = 3).
Figure 6. DSC thermograms of PLGA (A), RIS (B), physical mixture of PLGA, and RIS (C), and RIS-loaded PLGA NPs (D).
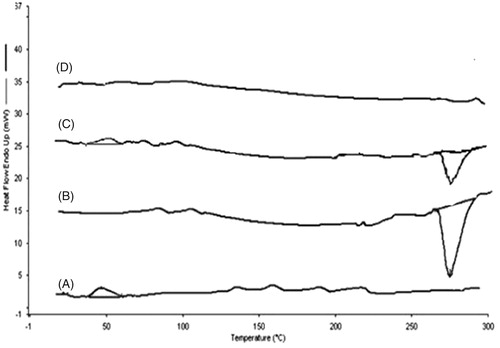
Table 4. DSC thermograms of PLGA, RIS, physical mixtures, and PLGA-NPs.
Figure 7. In vitro release profile of RIS from RIS-loaded PLGA-NPs and RIS drug solution.
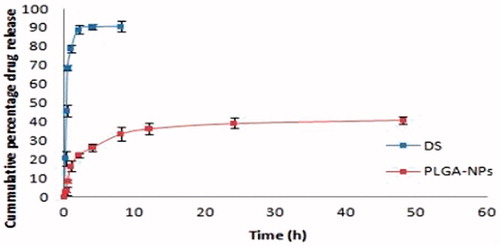
Table 5. Co-efficient of correlation for optimized PLGA-NPs from release kinetics.
Figure 8. Comparative permeation study of RIS from drug solution and PLGA-NPs.
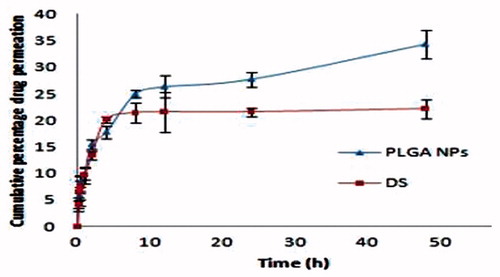
Table 6. Experimental groups and their treatments.
Table 7. Effects of formulations on various biochemical parameters in DEXA (8 mg/kg body weight) induced osteoporotic animals (n=3) (mean value ± S.D.).
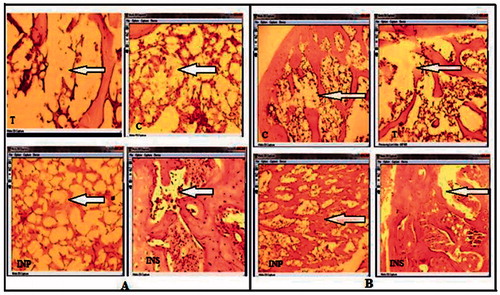
Figure 9. Internal structure of rat bone of treated groups T – toxic, C – control, INP – intranasal NPs, INS – intranasal solution (magnification: A – 40× and B – 10×).