Figures & data
Table 1. List of proposed recombinant proteins for siRNA delivery.
Figure 1. SDS Page analysis of the purity of the protein. Recombinant proteins (2 and 3) produced by Escherichia coli were purified by His-Trap from GE in the native condition. The other proteins (5, 7, 10, and 11) were purified via the denature method.
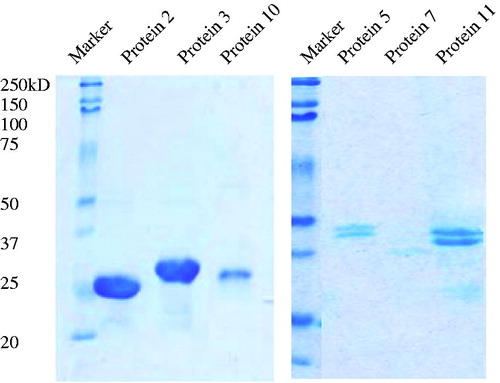
Figure 2. Gel retardation assays of protein 2, 3, 5, 7, 10, and 11 binding siRNA (100 pmol of siRNA) at different molar rates of protein/siRNAs.
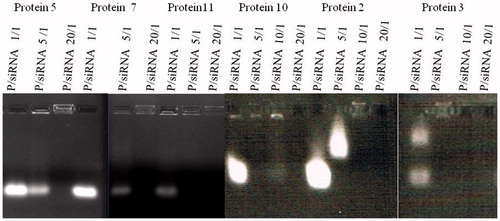
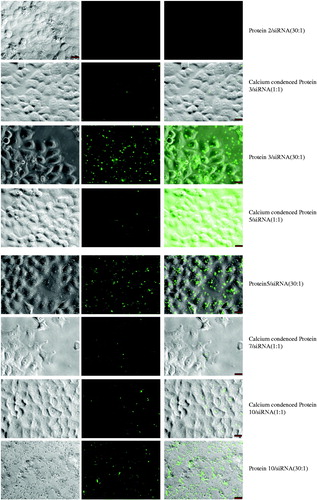
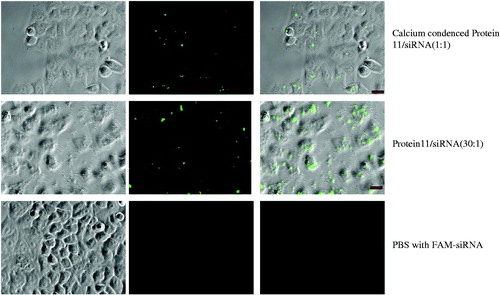
Figure 4. In vitro screening of proteins for siRNA delivery in GFP-expression HeLa cells. (A) The cells were treated with protein/siRNA complexes at mol rate of 20:1. (B) 48 h after treatment, the average reduction percentages of GFP expression in cells. These complexes of protein/siGFP were prepared at mol rate of 1:1 and condensed in the 23.1 mM CaCl2 buffer, as calculated from at least triplicate parallel samples and showed above (A, n = 3; B, n = 4). Asterisk (**) indicates p < 0.01 based on analysis of one sample t test and one-way ANOVA post-hoc multiple comparisons (LSD as the variances assumed).
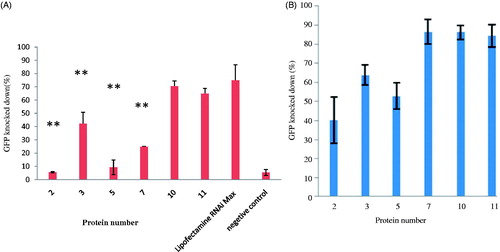
Figure 5. Screening the efficiency of the recombinant protein siRNA delivery GAPDH siRNA on HeLa cell GAPDH. The Western blot was used to analyze the RNAi efficiency at protein/siRNA ratio of 1:1 condensed in the 23.1 mM CaCl2 or at a ratio of 30:1. Lipofectamine RNAi Max used as the positive control. After 48 h treatment, the expressions of GAPDH after siRNA delivery were shown in contrast to the expression of HSC70 in the control sample.
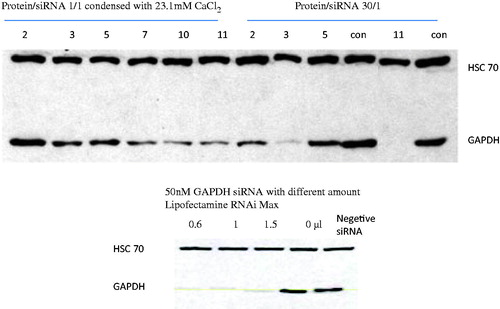
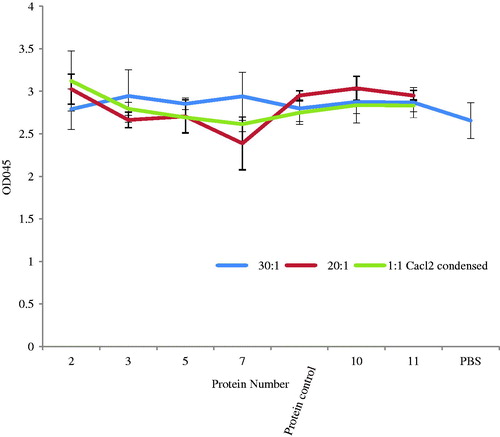
Figure 6. The viability of cell treatment of these recombinant proteins with siRNA. The OD 450 of cells was measured 48 h after the treatment with different amounts of proteins (0.1 μM, 2 μM, or 3 μM) as well as the protein amount used in the knockdown efficiency assay with protein/siRNA at a ratio of 1:1 combined with 23.1 mM CaCl2, of 20:1 or 30:1, respectively. The data are presented as mean ± standard deviation calculated from parallel triplicate samples (n = 3).