Figures & data
Table 1. Formulation compositions of the SLMs.
Figure 1. DSC thermograms of: (a) dika wax, (b) lipid matrix 1:19, (c) lipid matrix 1:9, (d) lipid matrix 1:6, (e) lipid matrix 1:4, and (f) lipid matrix 1:3.
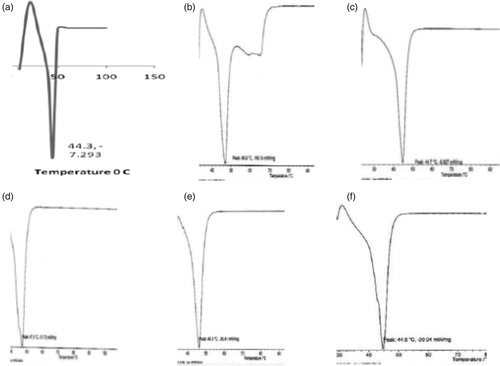
Table 2. DSC results of the lipid matrices.
Figure 2. SAXD differactograms of different batches of structured lipid matrices formulated with different ratios of soybean oil and dika wax. S:D = soybean oil: dika wax.
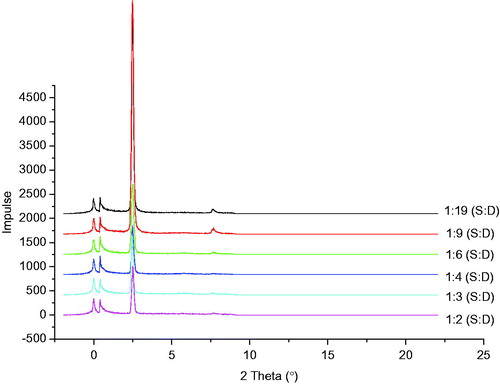
Figure 3. WAXD diffractograms of different batches of structured lipid matrices formulated with different ratios of soybean oil and dika wax. S:D = soybean oil: dika wax.
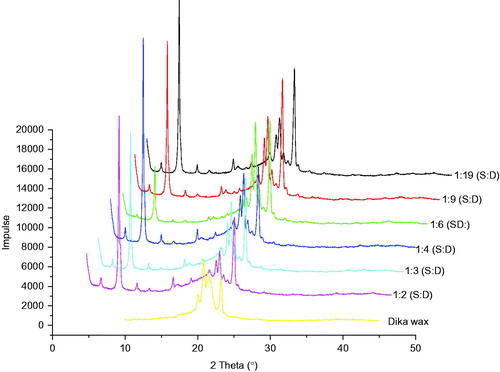
Figure 4. Photomicrographs (at day 1) of SLMs formulated with lipid matrices 1:19, 1:6 and 1:3 and containing 2.5 g of artesunate, A4, B4 and C4.
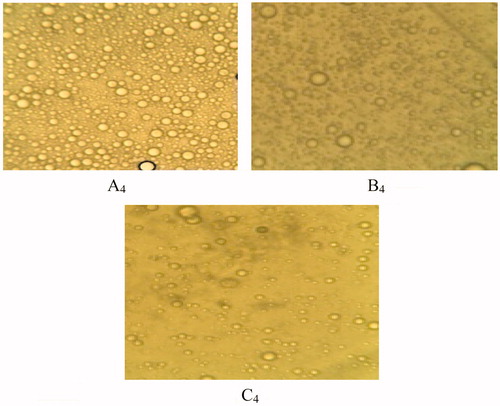
Figure 5. Particle size of artesunate-loaded and unloaded SLMs over time (a): A1 – A5 were formulated with LM 1:19, (b): B1 – B5 were formulated with LM 1:6 and (c): C1 – C5 were formulated with LM 1:3 and different concentrations of artesunate, while A5, B5, and C5 contain no API; □, day 1; ▪, 30 days and ▪, 90 days for a, b and c, respectively.
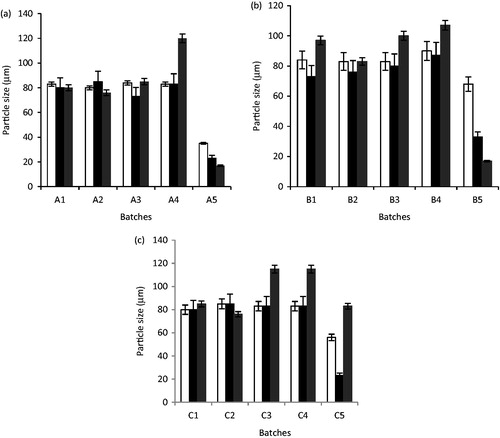
Figure 6. The pH of unloaded and artesunate-loaded SLMs (a): A1 – A5 were formulated with LM 1:19, (b): B1 – B5 were formulated with LM 1:6 and (c): C1 – C5 were formulated with LM 1:3 and different concentrations of artesunate, while A5, B5 and C5 contain no API; □, day 1; ▪, 30 days and ▪, 90 days for a, b and c, respectively.
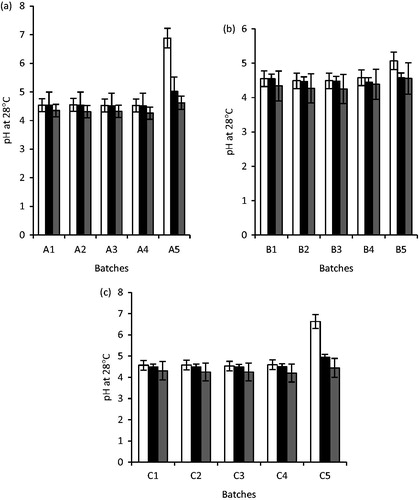
Table 3. Some properties of artesunate-loaded SLMs.
Figure 7 In vitro release profile of artesunate from SLMs; ♦ - A4, □-B4, ▴ – STD, batches A4 and B4 were formulated with lipid matrices 1:19 and 1:6 and contain 2.5% artesunate, respectively; STD is the artesunate tablet (reference).
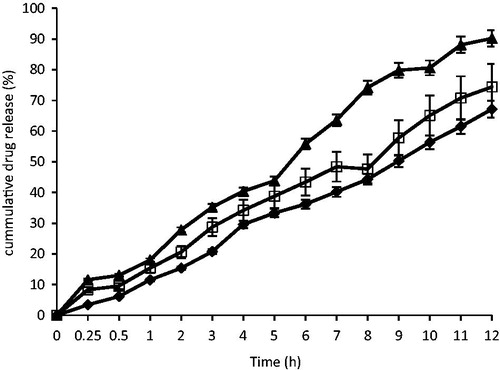
Table 4. Drug release kinetics of artesunate-loaded SLMs.
Figure 8. Percent parasitaemia of mouse treated with artesunate-loaded SLMs. Significant at p < 0.05 compared to control. Values shown are mean ± SD (n = 5). □, STD; ▪, TARF; ▪, CTL; TARF representents group that received the artesunate-loaded SLMs the artesunate-loaded SLMs; STD received the standard artesunate tablet, while group CTL (control) received normal saline.
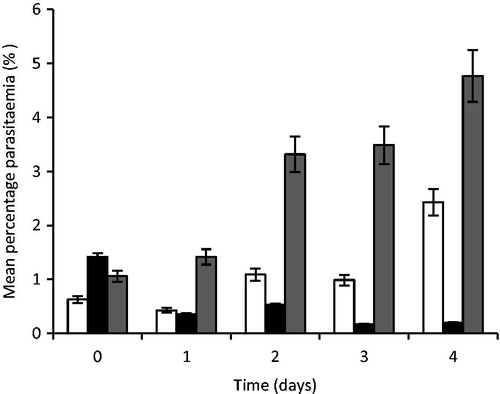
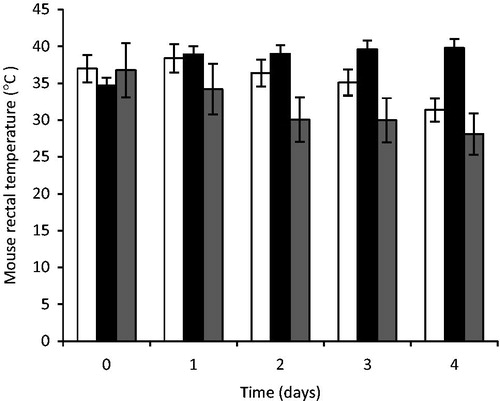
Figure 9. Rectal temperature of mouse treated with artesunate-loaded SLMs. Significant at p < 0.05 compared to control. Values shown are mean ± SD (n = 5). □, STD; ▪, TARF; ▪, CTL; TARF representents group that received the artesunate-loaded SLMs the artesunate-loaded SLMs; STD received the standard artesunate tablet, while group CTL (control) received normal saline.