Figures & data
Figure 1. (A) Chemical structure of AE. (B) Effect of HPH pressure and cycle times on particle size. (C) Effect of lipid concentration on particle size and zeta-potential of AE-SLNs at 10, 20 and 30 mg/ml. (D) Effect of different proportion of surfactant to lipid on particle size and zeta-potential.
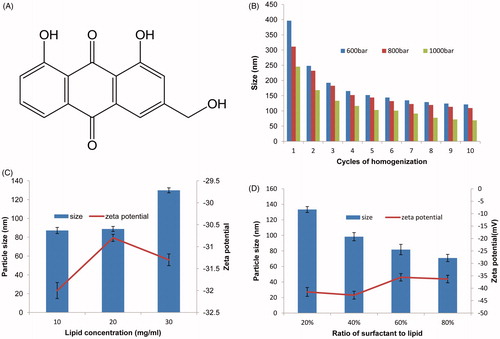
Table 1. Effect of lipid materials on particle size and zeta potential of AE-SLNs.
Table 2. Effect of different surfactants on particle size and zeta potential of AE-SLNs.
Figure 2. Physical characterization result of AE-SLNs. (A) The particle size distribution of AE-SLNs. (B) Transmission electron microscopy of AE-SLNs.
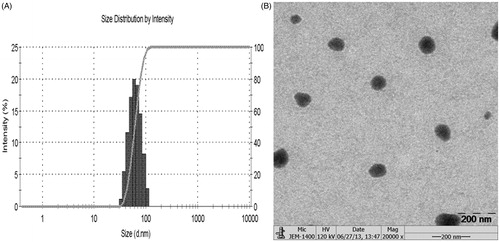
Table 3. The results of formulation assay.
Figure 3. DSC thermogram of free AE, lipid material, physical mixture and AE-SLNs. The characteristic peaks of AE crystals and lipid material appeared at 224 °C and 62 °C respectively, but the thermogram of AE-SLNs presented only one characteristic peak at 51 °C, revealing that AE-SLNs have been successfully prepared.
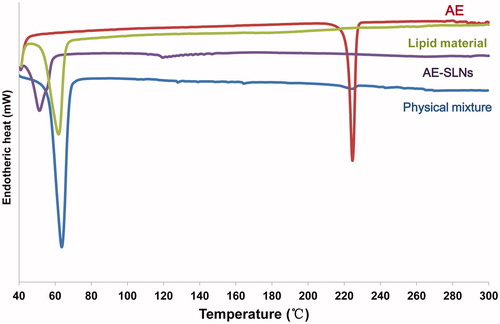
Figure 4. In vitro drug release profiles of free AE and AE-SLNs.
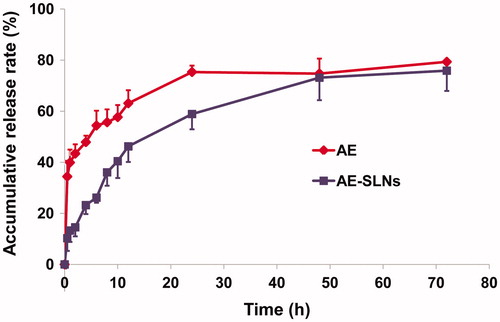
Figure 5. Cytotoxicity analysis of free AE, B-SLNs and AE-SLNson MCF-7, HepG2 and MCF-10 A cells at the concentration of 0.1–2.5 μM. Data are shown as mean ± S.D. (n = 3). *p < 0.05, **p < 0.01, AE-SLNs versus Free AE.
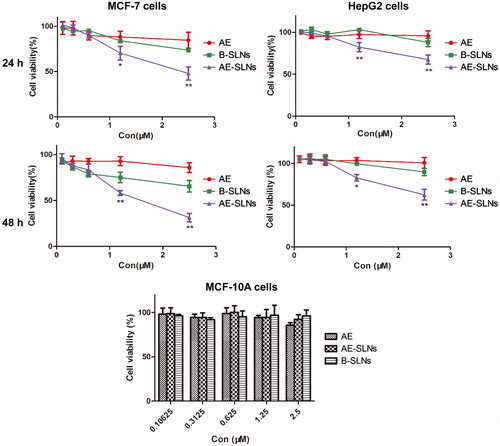
Figure 6. Hoechst 33342 fluorescent staining to detect apoptotic morphology in breast cancer cells, MCF-7 cells were treat with B-SLNs, Free AE and AE-SLNs at 2.5 μM for 48 h. The cell morphology was observed by Incell Analyzer 2000 (GE Healthcare Life Sciences, USA).
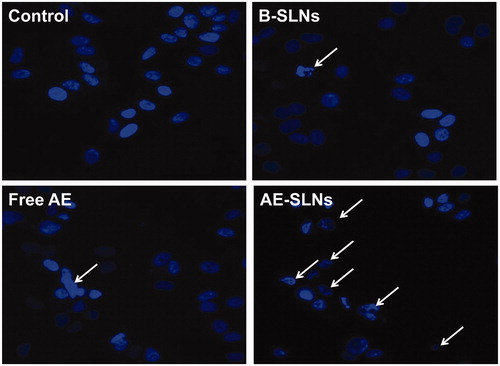
Figure 7. Quantitative apoptotic measurement in MCF-7 cells with treatment of Free AE, B-SLNs and AE-SLNs. (A). Results of dose dependent effect are expressed as dot plot of AnnexinV-FITC versus PI and representative values are shown. (B). The results are expressed as bar chart. Data as mean ± S.D. (n = 3). **p < 0.01, AE-SLNs versus Free AE.
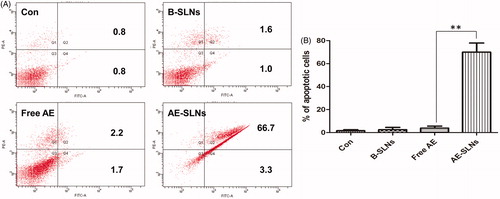
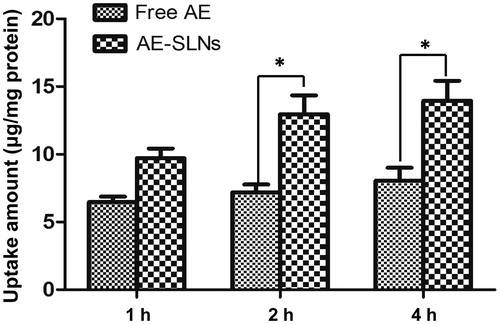
Figure 8. Cellular uptake amount of AE treated with free AE and AE-SLNs at 5 μMwithin 4 h by MCF-7 cells. Data were expressed as mean ± S.D. (n = 3). *p < 0.05, AE-SLNs versus free AE.