Figures & data
Table 1. Characteristics of the formulated Cbp-based gel of PTX for bone induction.
Figure 1. Rheograms of the formulated Cbp-based gels: (a) 1% Cbp, (b) 3% Cbp.
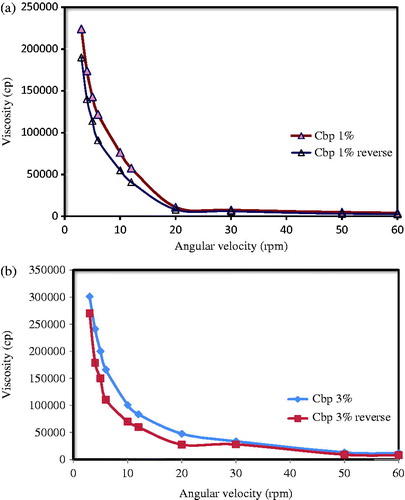
Figure 2. DSC thermogram of the Cbp polymer, pure drug (PTX), physical mixture of PTX: Cbp (1:1) and PTX Cbp-based gel.
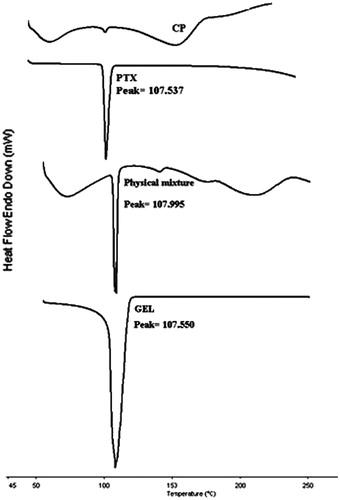
Figure 3. Release profile of PTX from the formulated Cbp-based gels in Sorenson phosphate buffer pH 6.6 at 37 °C. (Each point represent the mean ± SD, n = 3).
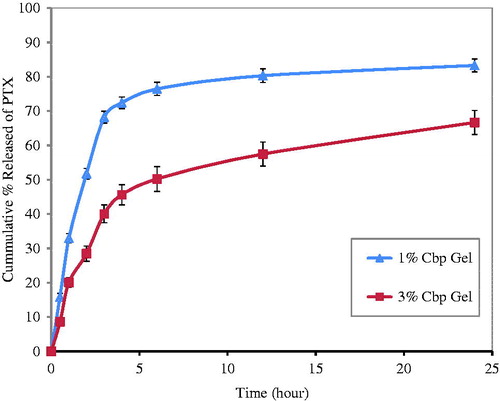
Table 2. Comparing the DE%, T50%, release rate constant (k) and exponent n of different Cbp-based gel formulations of Pentoxyfilline in Sorenson phosphate buffer pH 6.6.
Figure 4. Effect of ageing on drug content of the Cbp-based gels at ambient temperature. (Each point represent the mean ± SD, n = 3).
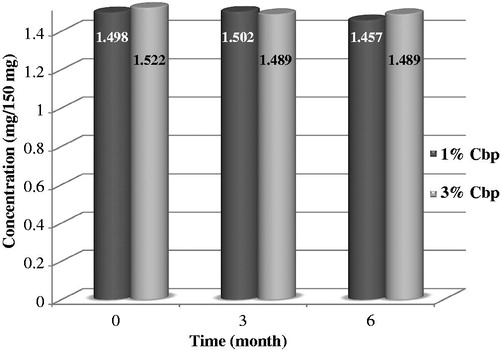
Figure 5. Effect of ageing on the release profiles of PTX from: (a) 1% Cbp (b) 3% Cbp gels in Sorenson phosphate buffer pH 6.6 at 37 °C. (Each point represent the mean ± SD, n = 3).
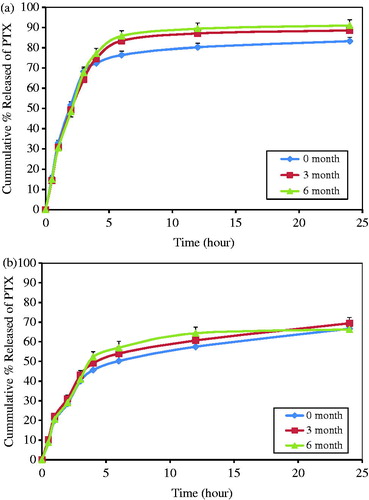
Figure 6. Effect of ageing on rheological property of the Cbp-based gels: (a) 1% and (b) 3% at ambient temperature.
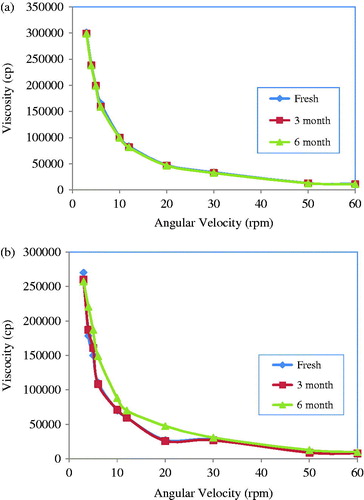
Figure 7. Percentage increase in bone density after local application of PTX Cbp based gels after two months in rabbits.
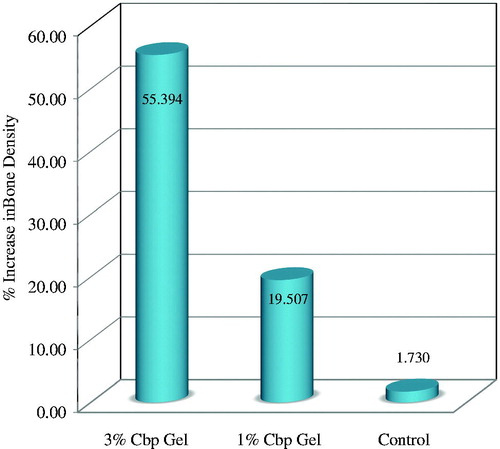
Figure 8. (a) SEM of group C (3% gel) at the end of study period showing intimate bone implant contact with no gap (500×). (b) SEM of Control group A showing a gap extending along the bone implant interface. (500×).
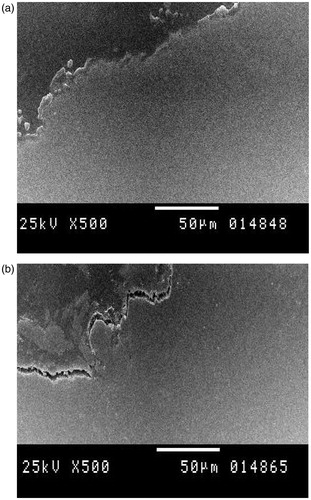
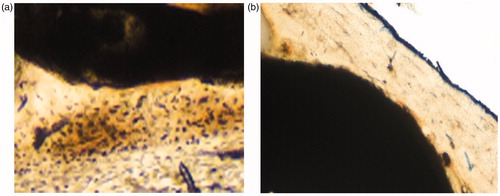
Figure 9. Photomicrograph (100×) ground section of: (a) 3% gel group showing well organized mature bone with no gap and (b) control group showing immature bone.