Figures & data
Figure 1. The molecular structure of Tamibarotene (Am80).
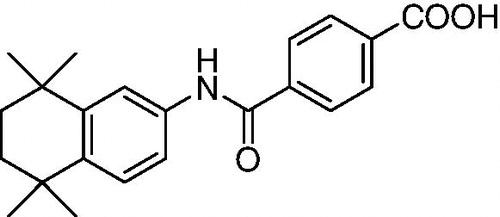
Table 1. Compositions of the two nanoparticle formulations of Am80.
Figure 2. Photographs of Am80-PEG-NLC: (A) fresh-prepared, (B) freeze-dried, and (C) the suspension of freeze-dried powder.
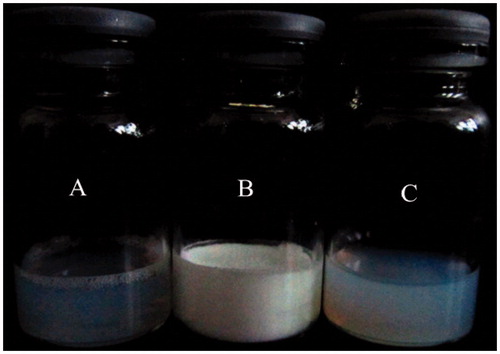
Figure 3. Transmission electron microscopy micrographs of Am80-PEG-NLC.
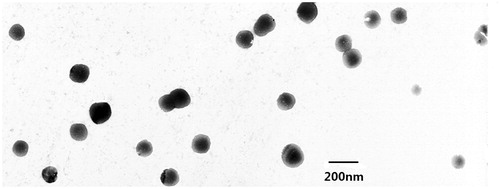
Table 2. The mean particle size, size distribution, zeta potential, and entrapment efficiency of the two Am80 formulations, each data was expressed as mean ± SD (n = 5).
Figure 4. In vitro release profile of Am80-NLC and Am80-PEG-NLC (n = 3).
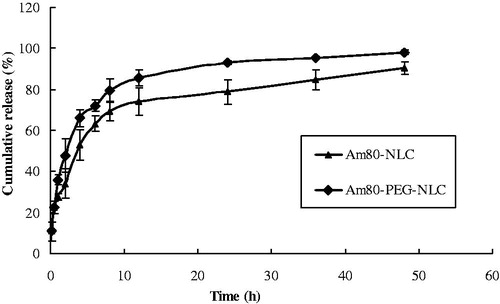
Figure 5. Mean plasma concentration–time curves of Am80 in rats after i.v. administration of Am80-NLC and Am80-PEG-NLC at a dose of 4.5 mg/kg (n = 5).
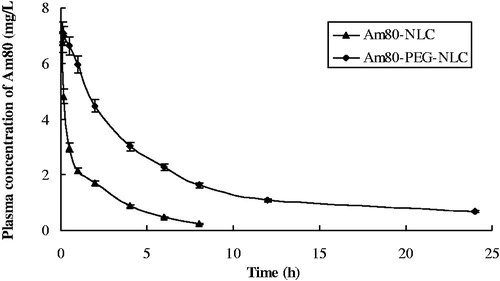
Table 3. Main pharmacokinetic parameters of Am80 in rats after i.v. administration of Am80-NLC and Am80-PEG-NLC at a single dose of 4.5 mg/kg (mean ± SD, n = 5).
Figure 6. Am80 concentration in tissue at different time points after i.v. administration of (A) Am80-NLC and (B) Am80-PEG-NLC (n = 5).
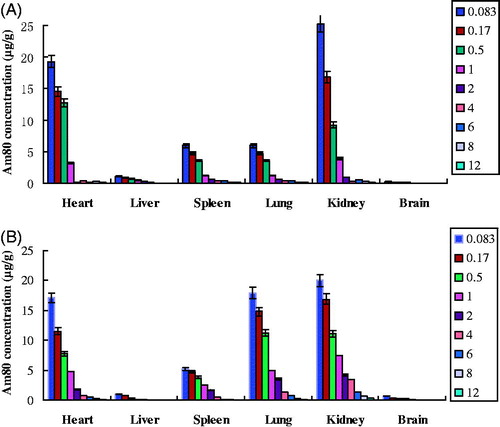
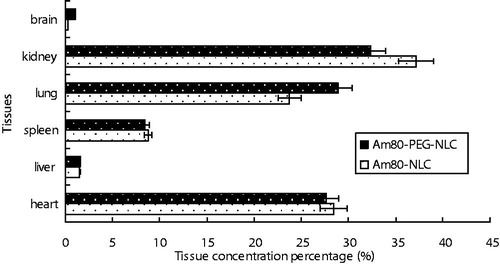
Figure 7. Am80 concentration percentage of different tissues at 5 min after i.v. administration of Am80-NLC and Am80-PEG-NLC (n = 5).