Figures & data
Table 1. The injection project of effect of different type of phospholipids on ABC phenomenon in rats.
Table 2. Mean particle sizes and entrapment efficiency of the prepared liposomes (n = 6).
Figure 1. Blood clearance (0–4 h) of calcein in rats after a second injection of PEGylated liposomes made of different types of phospholipid (n = 6).
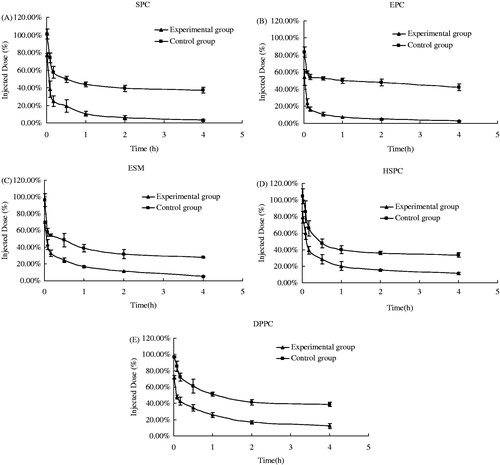
Figure 2. Liver (A) and spleen (B) biodistribution (4 h) of calcein in rats after a second injection of PEGylated liposomes made of different types of phospholipid (n = 6) (**p < 0.01).
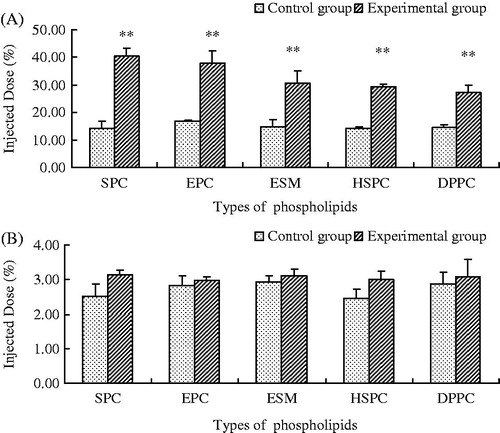
Table 3. Change of pharmacokinetics parameters in rat after repeated injections of PEGylated liposomes made of different types of phospholipids (n = 6).
Figure 3. Anti-PEG IgM response following a single intravenous injection of empty PEGylated liposomes made of different types of phospholipids in rats (n = 6) (**p < 0.01).
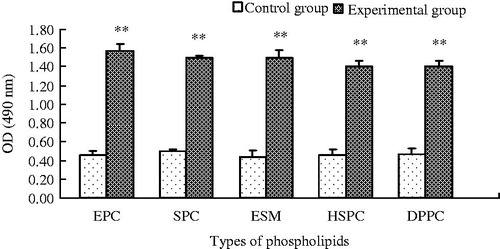
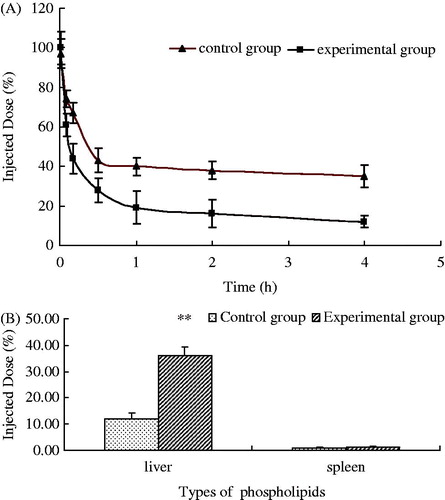
Figure 4. Blood clearance (0–4 h) (A) and liver (B) and spleen (C) biodistribution (4 h) of calcein in mice after a second injection of PEGylated EPC liposomes (n = 6) (*p < 0.05, **p < 0.01).
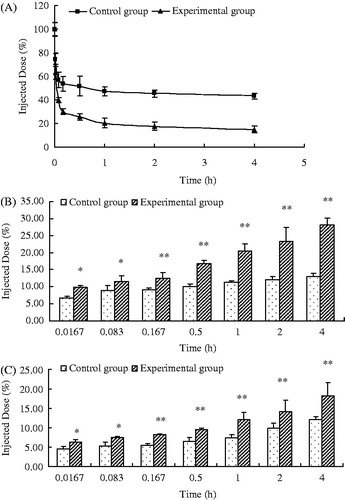
Figure 5. Blood clearance (0–4 h) (A) and biodistribution (4 h) (B) of calcein in rabbits after a second injection of PEGylated EPC liposomes (n = 6) (**p < 0.01).
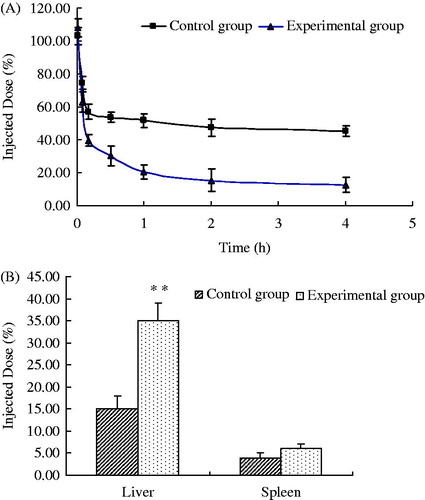
Figure 6. Blood clearance (0–4 h) and biodistribution (4 h) of calcein in guinea pigs after a second injection of PEGylated EPC liposomes (n = 6) (**p < 0.01).