Figures & data
Figure 1. Chemical structure of (a) alpha-asarone and (b) Kolliphor HS 15.
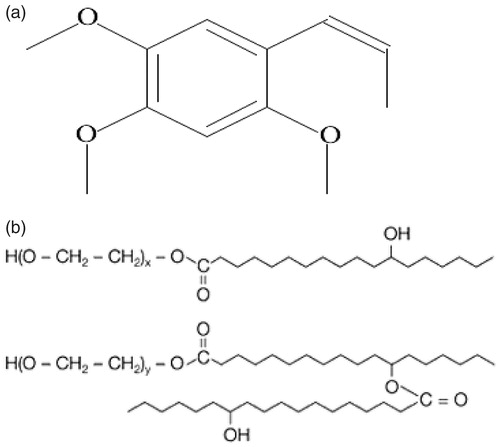
Figure 2. The spraying device of ultrasonic atomization in therapeutic effect study.
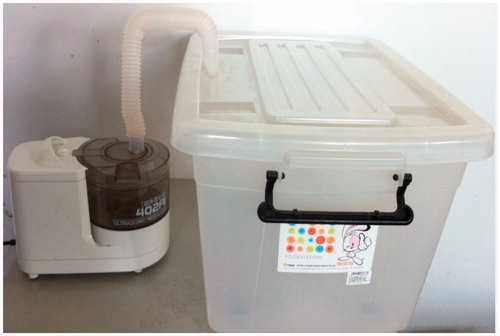
Figure 3. Transmission electron microscopy (TEM).
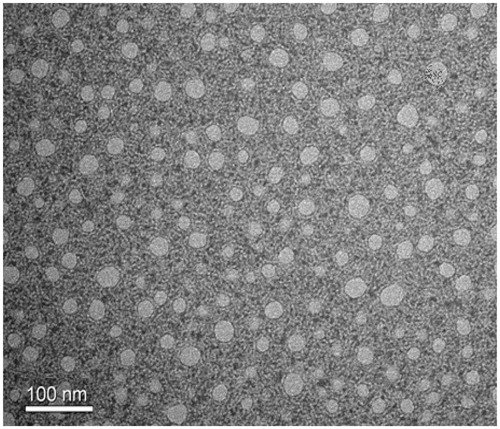
Table 1. The stability of the (a) Kolliphor HS 15-ARE at room temperature (25 °C) and (b) Kolliphor HS 15-ARE and CA-ARE after dilution.
Figure 4. Plot of the fluorescence of pyrene I1/I3 intensity ratio versus concentration of Kolliphor HS 15 in normal saline at 25 °C (n = 3).
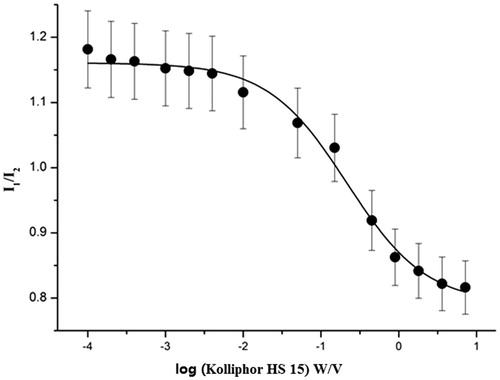
Table 2. Panel a: Design of the hemolysis assay of the Kolliphor HS 15-ARE and Panel b: the hemolysis assay of the Kolliphor HS 15-ARE.
Figure 5. Mean plasma concentration–time curves of ARE in plasma after intravenous injections of HS 15-ARE and CA-ARE. Each value represents the mean±standard deviation (n = 5).
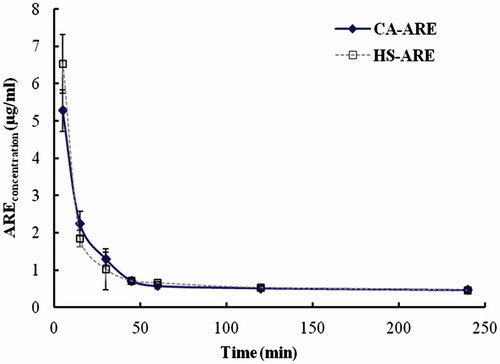
Table 3. The main pharmacokinetic parameters of HS 15-ARE and CA-ARE in rats (n = 5).
Figure 6. (a) AUC (mg/l min) for HS 15-ARE and CA-ARE in tissue distribution studies (n = 5). *p < 0.05; **p < 0.01; ***p < 0.001 (compared with CA-ARE). (b) The ARE concentration of Kolliphor HS 15-ARE and CA-AREs in tissues at times (10, 30, 60 and 120 min) post-injection (n = 5).
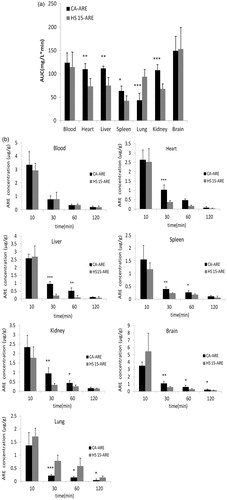
Figure 7. The histamine levels of different groups of guinea pigs in anaphylaxis study. ***p < 0.001 (compared with CA-ARE).
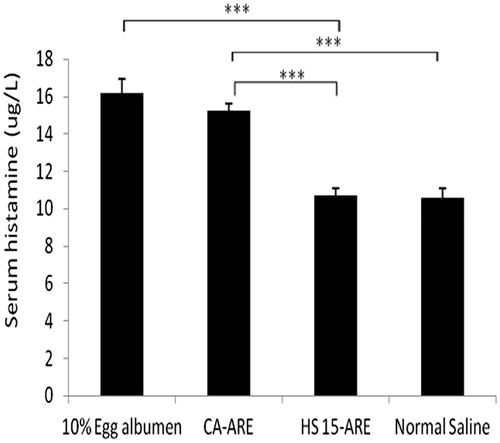
Table 4. The results of allergy symptoms of four groups of guinea pigs in anaphylaxis study.
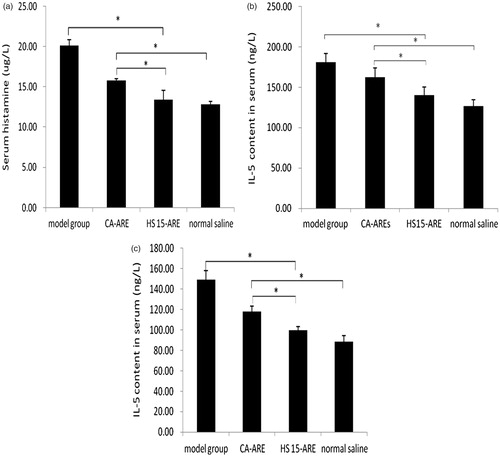
Figure 8. (a) The histamine level released into blood in Wistar rats. *p < 0.05 (compared with CA-ARE). (b) The IL-5 content in the serum of each group in Wistar rats. *p < 0.05 (compared with CA-ARE). (c) The IL-5 content in alveolar lavage fluid in Wistar rats. *p < 0.05 (compared with CA-ARE).