
Figures & data
Scheme 1. Synthesis of LDMP.
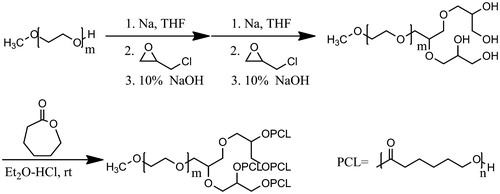
Figure 1. FT-IR spectrum of MPEG (A), LDMP (B) and ɛ-CL (C).
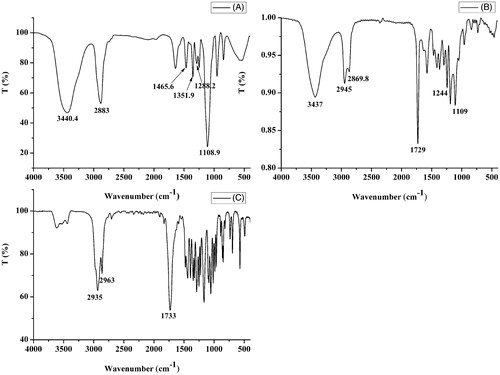
Figure 2. 1H-NMR spectrum of tetra-hydroxy MPEG (A) and LDMP (B).
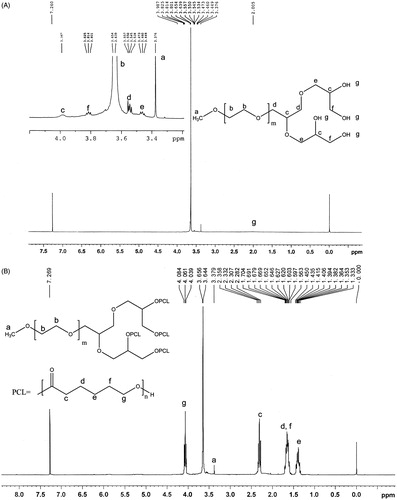
Figure 3. GPC of LDMP-2.
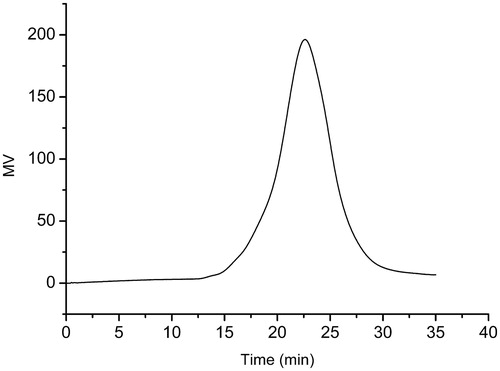
Table 1. Characteristics of micelles.
Figure 4. TEM of CUR micelles (38 000×, the scale bar is 100 nm).
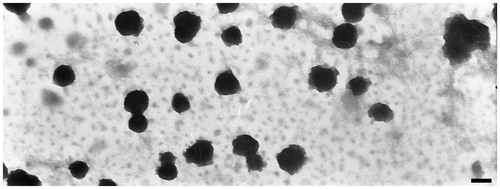
Figure 5. FT-IR spectrum of CUR, blank micelles and CUR micelles.
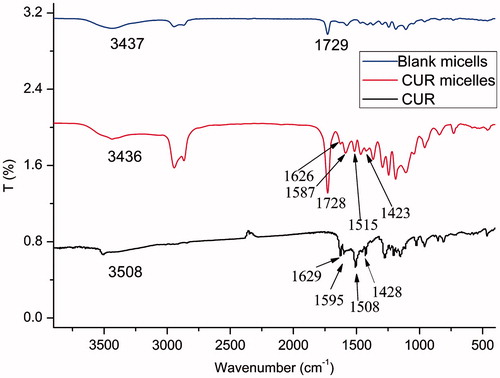
Figure 6. XRD of CUR, blank micelles and CUR micelles.
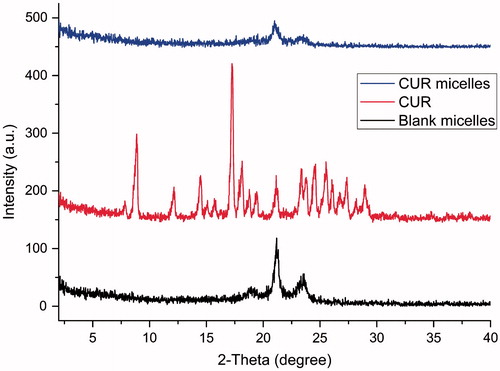
Figure 7. (A) Hemolysis test UV spectrum of different concentration of LMP, normal saline (negative control), and distilled water (positive control) and (B) percentage of hemolysis of different concentration of LDMP-2.
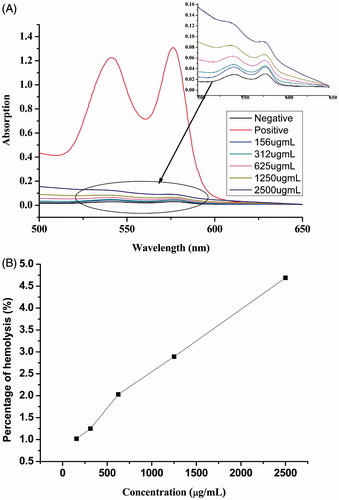
Figure 8. In vitro CUR-release profiles from either control solution or micelles in 40% ethanol saline solution at 37 °C [data are presented as mean ± SD (n = 3)].
![Figure 8. In vitro CUR-release profiles from either control solution or micelles in 40% ethanol saline solution at 37 °C [data are presented as mean ± SD (n = 3)].](/cms/asset/7a0a09a8-59b0-4839-b3d3-ad2c6ded4643/idrd_a_901436_f0008_b.jpg)
Table 2. Mathematical equations for the models used to describe release characteristics of CUR from micelles.
Figure 9. Anticancer activity of free CUR and CUR micelles on HT-29 and Hela cells in vitro after cultivation for 24 and 48 h [data are presented as mean ± SD (n = 4)].
![Figure 9. Anticancer activity of free CUR and CUR micelles on HT-29 and Hela cells in vitro after cultivation for 24 and 48 h [data are presented as mean ± SD (n = 4)].](/cms/asset/e5588b68-d4dd-4b5f-8957-194b7e0a18e6/idrd_a_901436_f0009_b.jpg)
Figure 10. Drug–time curves after i.v. injection of CUR control solution and CUR micelles [data are presented as mean ± SD (n = 6)].
![Figure 10. Drug–time curves after i.v. injection of CUR control solution and CUR micelles [data are presented as mean ± SD (n = 6)].](/cms/asset/0ad11a05-d57c-467c-a815-6b9194a886da/idrd_a_901436_f0010_c.jpg)