Figures & data
Figure 1. Identification of iRGD conjugation and characteristics of DOX liposomes. (A) Synthetic reaction monitored by HPLC at the beginning, 12 and 48 h later. (B) Identification of the reaction product by MALDI-TOF MS. (C) Morphology of iRGD-SSL-DOX measured by TEM. (D) In vitro release rate of SSL-DOX and iRGD-SSL-DOX. 0.5 ml liposome and 0.5 ml FBS were placed in a dialysis bag (Mw cutoff 12 000–14 000 Da) and incubated in 50 ml PBS at 37 °C with gentle shaking (100 rpm). The released DOX was measured by HPLC at predetermined time points (n = 3).
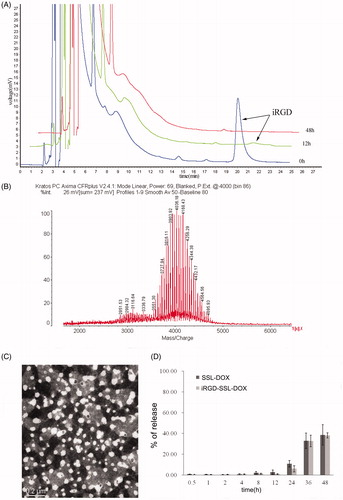
Table 1. Characteristics of SSL-DOX and iRGD-SSL-DOX (mean ± SD, n = 3).
Figure 2. Receptor expression of integrin α5β1 and Nrp-1 on B16 cells. Receptors and nuclei were stained with fluorescein and Hoechst 33258, respectively. Circled or spotted staining surrounding the nucleus demonstrated the expression of these membrane receptors.
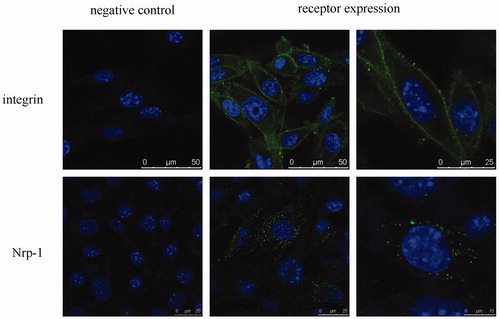
Figure 3. Comparison of the cellular uptake of liposomes modified with different iRGD content by B16 cells at 37 °C for 1 h: 0% DSPE-PEG2000-iRGD (A), 1% DSPE-PEG2000-iRGD (B), 2% DSPE-PEG2000-iRGD (C), 5% DSPE-PEG2000-iRGD (D), 10% DSPE-PEG2000-iRGD (E), free DOX (F, positive control). The content of DSPE-PEG2000-iRGD was the molar percentage in total DSPE-PEG2000.
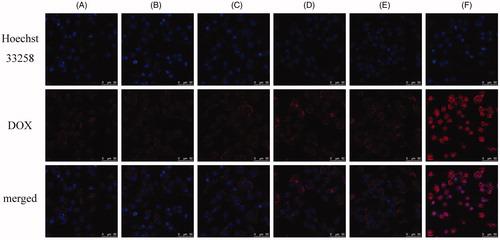
Figure 4. Uptake of SSL-DOX, iRGD-SSL-DOX or iRGD + iRGD-SSL-DOX by B16 cells after incubation at 37 °C for 3 h. (A) Representative result of three experiments by flow cytometry. (B) The quantitative result of flow cytometry. Results are means ± SD (n = 3). **p < 0.01 versus SSL-DOX and ##p < 0.01 versus iRGD-SSL-DOX. (C) Uptake studies measured by confocal microscopy: (a) SSL-DOX, (b) iRGD-SSL-DOX and (c) iRGD + iRGD-SSL-DOX.
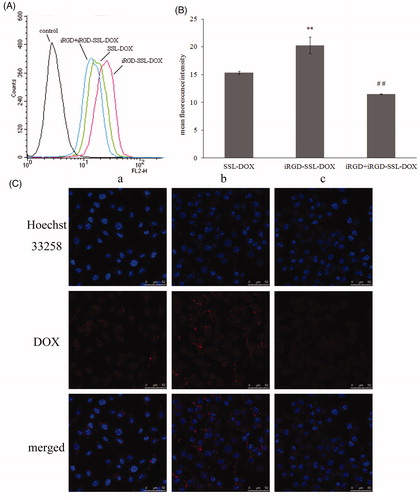
Table 2. IC50 values of DOX, SSL-DOX and iRGD-SSL-DOX on B16 cells in vitro after 48-h incubation (mean ± SD, n = 6).
Figure 5. In vivo (A) and ex vivo (B) fluorescent images of B16 tumor-bearing mice treated with free DiR, SSL-DiR or iRGD-SSL-DiR. The distribution of fluorescent formulations at different time points after administration is shown. Tumor regions were located in the armpit of right forelimbs, as indicated by arrows.
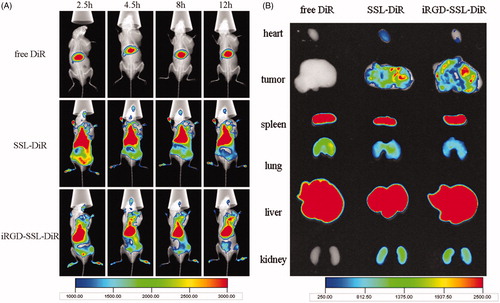
Figure 6. In vivo DOX cellular uptake in tumor tissues from tumor-bearing C57BL/6 mice treated with SSL-DOX or iRGD-SSL-DOX. Results are means ± SD (n = 3).
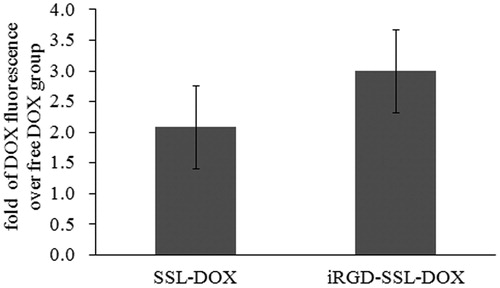
Figure 7. In vivo anti-tumor efficacy and toxicity. (A) Tumor volume of tumor-bearing C57BL/6 mice treated with: PBS, free DOX, SSL-DOX or iRGD-SSL-DOX. Arrow points indicated the time for administration. Results are means ± SD (n = 6). *p < 0.05 versus PBS control, **p < 0.01 versus PBS control, #p < 0.05 versus SSL-DOX group. (B) Picture of the excised tumors. (C) Tumor weight of C57BL/6 mice with different treatments. Results are means ± SD (n = 6). **p < 0.01 versus PBS control, ##p < 0.01 versus SSL-DOX group. (D) Body weight changes during different treatments. Results are means ± SD (n = 6). (E) Changes of body weight with tumors removed compared to initial weight before treatment. Results are means ± SD (n = 6). *p < 0.05 versus PBS control. (F) Comparison of HGB level of different treatments. Results are means ± SD (n = 6). *p < 0.05 versus PBS control.
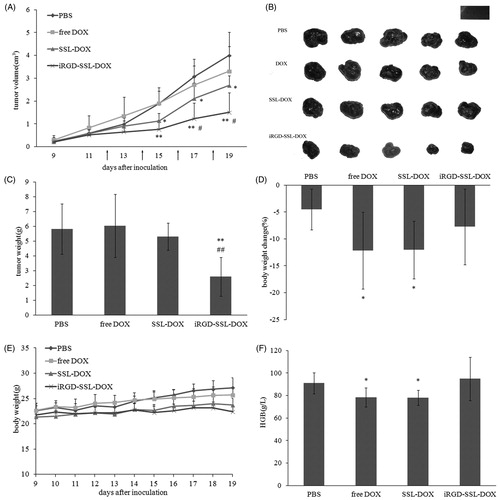
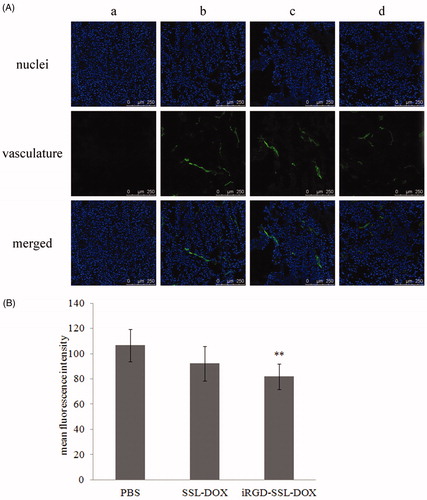
Figure 8. Tumor vasculature changes after different treatments. (A) Representative CLSM images of tumor vasculature from mice treated with: PBS (b), SSL-DOX (c) or iRGD-SSL-DOX (d). Vasculature and nuclei were labeled by FITC and Hoechst 33258, respectively. Negative control (a) for vasculature staining is also shown. The stripped staining demonstrated the tumor vasculature. (B) Quantitative result of CLSM images. 6 visual fields of each group were used for statistical analysis. **p < 0.01 versus PBS control group.