Figures & data
Figure 1. The chemical structures of buprenorphine and thienorphine.
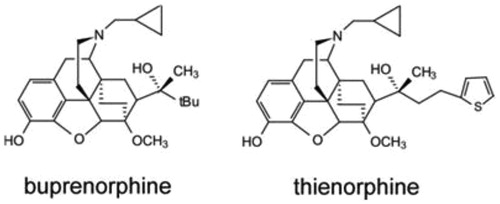
Table 1. Characteristics of PLGA-NPs and CS-PLGA-NPs (mean ± SD, n = 3).
Figure 2. Morphological appearance of NPs observed using TEM (A: PLGA-NPs; B: CS-PLGA-NPs) and AFM (C: PLGA-NPs; D: CS-PLGA-NPs).
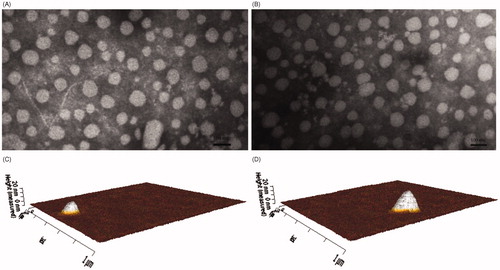
Figure 3. Drug release from PLGA-NPs and CS-PLGA-NPs in vitro (mean ± SD, n = 3).
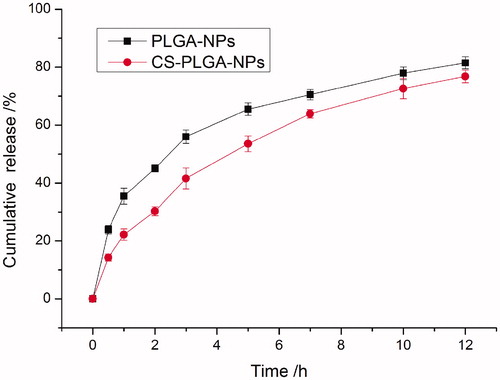
Figure 4. amount of thienorphine in the lumen content of the gastrointestinal tract after oral administration of 2 ml solution or NPs dispersion containing 0.5 mg thienorphine. Each experiment was performed in triplicate.
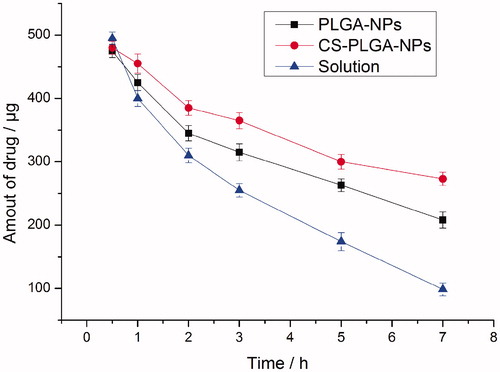
Figure 5. Fluorescent images of intracellular uptake of 6-coumarin-PLGA-NPs and 6-coumarin-CS-PLGA-NPs.
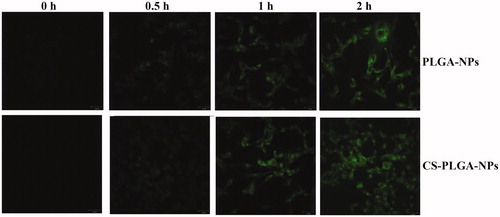
Figure 6. Effect of NPs on the permeability of thienorphine (mean ± SD, n = 3).
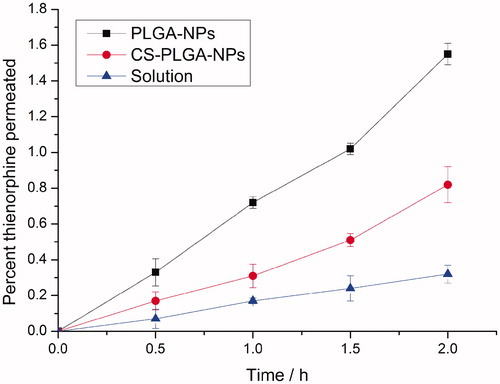
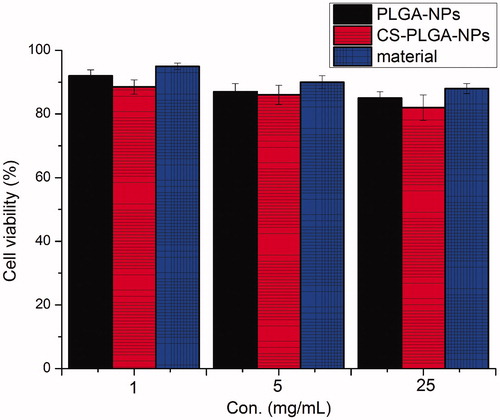
Figure 7. MTT assay evaluation of cytotoxicity after 2 h of incubation with PLGA polymer, blank PLGA-NPs, and blank CS-PLGA-NPs.