Figures & data
Figure 1. Scanning electron microscopy (SEM) images of insulin-loaded alginic acid nanoparticles.
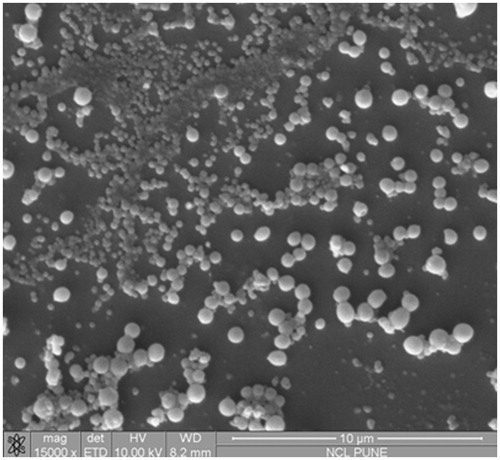
Table 1. Physico-chemical properties of insulin-loaded alginic acid nanoparticles with/without nicotinamide.
Figure 2. FTIR spectra of (a) alginic acid, (b) insulin and (c) alginic acid nanoparticles of insulin.
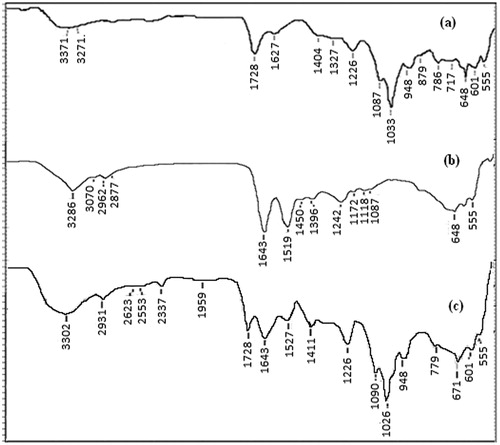
Figure 3. Thermograms of (a) insulin, (b) alginic acid, and (c) insulin nanoparticles.
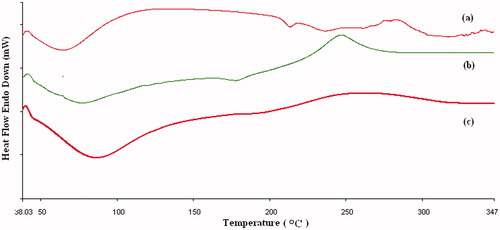
Figure 4. Stability of insulin nanoparticles at the end of 12 months evaluated by (a) CD spectra, (b) drug content (c) particle size.
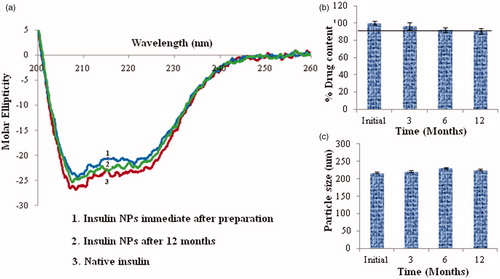
Figure 5. Effect of single administration of insulin on (a) serum insulin level and (b) serum glucose level in streptozotocin-induced diabetic rats, (—•—) insulin solution (subcutaneous-1 IU/kg), (—♦—) insulin nanoparticles (sublingual-5 IU/kg), (—▴—) insulin nanoparticles with nicotinamide and (—×—)blank nanoparticles with nicotinamide (n = 6).
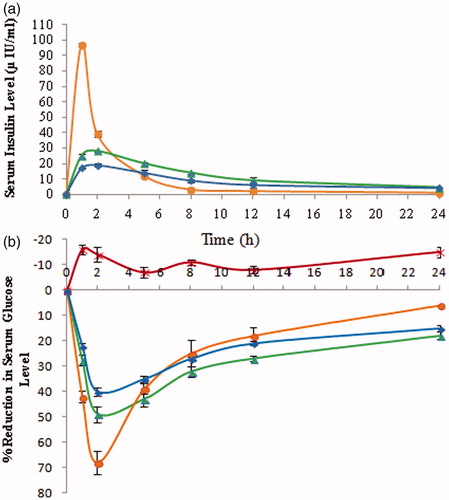
Table 2. Pharmacodynamic and pharmacokinetic parameters obtained by administration of insulin solution or nanoparticles to the diabetic rats.
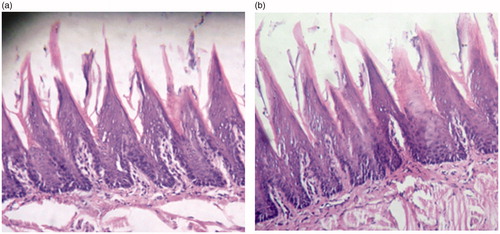
Figure 6. Light micrographs of the sublingual rat mucosal membranes following administration of INS-NPs (5 IU/kg) containing nicotinamide (a) and distilled water as control (b).