Figures & data
Table 1. Quantities of material used for SLM formulation.
Table 2. Properties of the SLMs formulation.
Table 3. Anti-inflammatory activity and time-resolved pH analysis.
Figure 1. Photomicrographs of SLM-0 (0 mg DicNa) SLM-1 (25 mg DicNa), SLM-2 (50 mg DicNa), SLM-3 (75 mg DicNa) and SLM-4 (100 mg DicNa) after 2 weeks of preparation. Bar represents 65.0 μm.
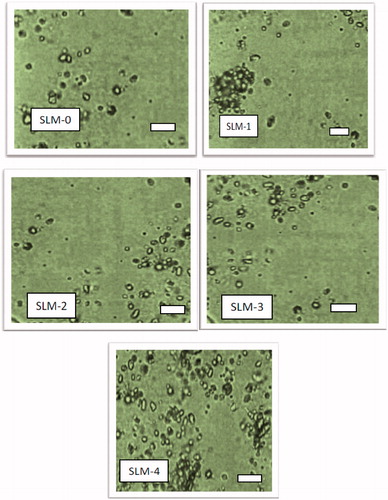
Figure 2. Particle-size distribution of formulations a SLM-1 to SLM-4 containing 25, 50, 75 and 100 mg of diclofenac sodium, respectively. SLM-0 is the unloaded formulation.
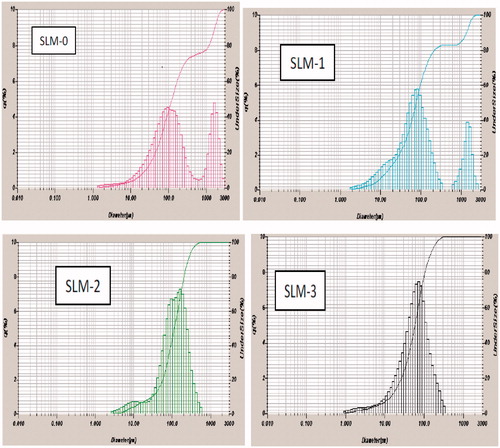
Figure 3. In vitro release profile of DicNa from SLM formulated in phosphate buffer (pH 7.4) system. SLM-1 to SLM-4 contains 25, 50, 75 and 100 mg of DicNa, respectively.
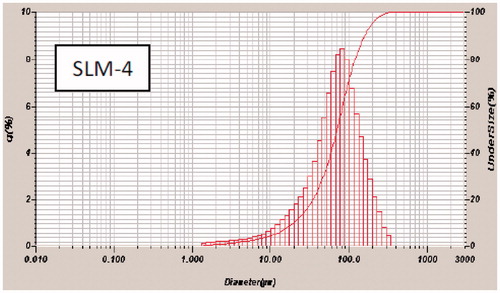
Figure 4. Mean ulcer index (±SD) of SLM-0 to SLM-4 containing 0, 25, 50, 75 and 100 mg of DicNa, respectively. PS represent the pure sample (diclofenac sodium) as a positive control.
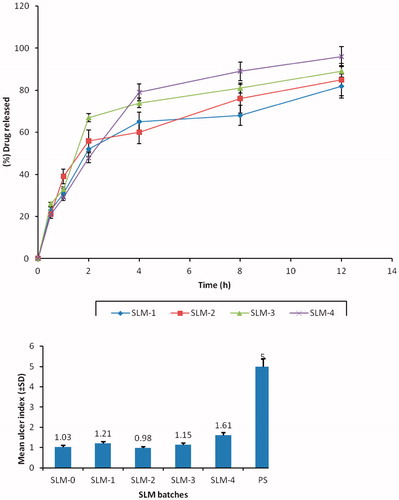
Figure 5. Percentage GI protection of SLM-0 to SLM-4 containing 0, 25, 50, 75 and 100 mg of DicNa, respectively. PS represent the pure drug sample as a positive control.
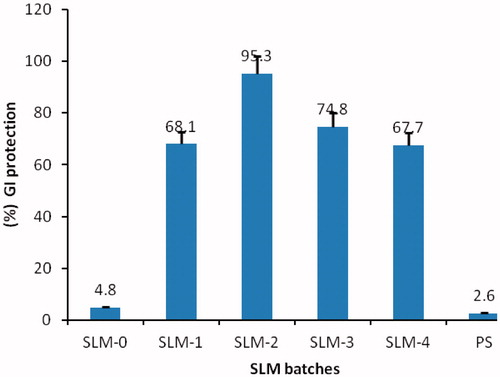
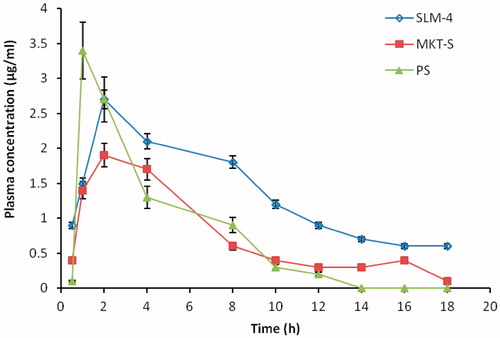
Figure 6. Plasma concentration versus time plotting of DicNa after oral administration of SLM-4, PS and MKT-S within 18 h (mean ± SD, n = 3). DicNa = diclofenac sodium, SLM-4 = batch 4 of the diclofenac sodium-loaded SLMs, PS = pure drug and MKT-S = market sample of diclofenac sodium.