Figures & data
Figure 1. Scheme of folate-PEG-DSPE synthesis and structural confirmation using NMR spectra.
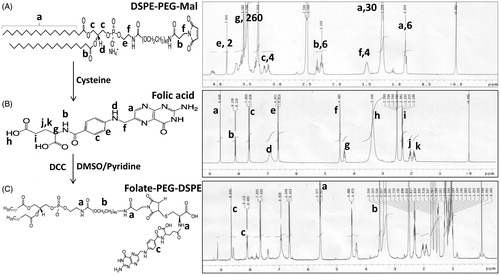
Figure 2. Schematic showing encapsulation of DTX into lipid core of NE and its surface is modified with Gd and folate for MRI functionality and targeting, respectively.
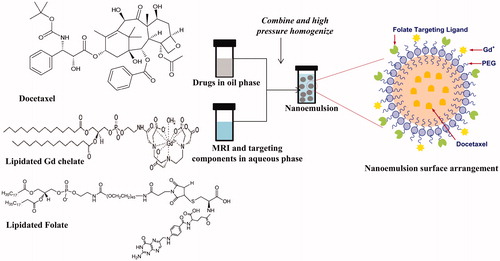
Table 1. Characterization of formulations.
Figure 3. TEM Transmission electron microscopy images of NE formulations (A) Blank NE (NT), (B) Blank NE (Folate), (C) DTX-NE (NT), and (D) DTX-NE (Folate).
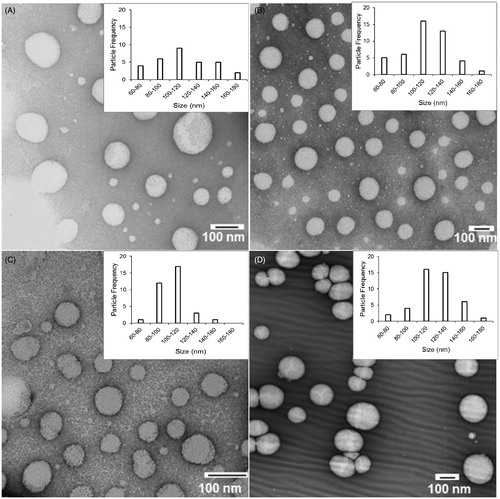
Figure 4. DTX release from the non-targeted and folate targeted NE formulations in PBS (pH 7.4) containing 0.5% Tween 80 at 37 °C. The data are shown as mean ± SD (n = 3).
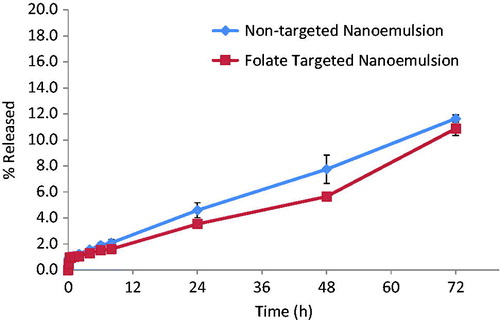
Table 2. Drug release kinetics.
Figure 5. Physical stability of DTX containing non-targeted and folate targeted NE formulations upon 90% dilution in dog plasma, parenteral infusion fluids (5% dextrose and 0.9% sodium chloride) and phosphate buffered saline. The data are shown as mean ± SD (n = 3).
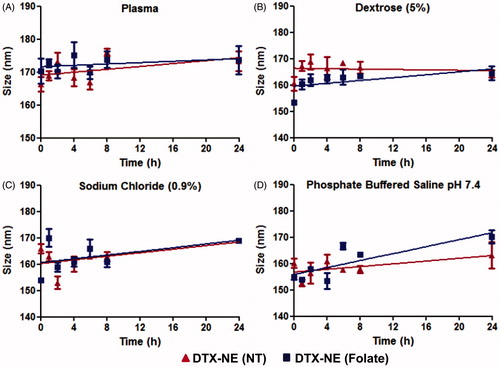
Figure 6. Fluorescent microscopy images showing uptake of NBD-ceramide (green) containing non-targeted and folate targeted NEs in SKOV3 cells. Lyso Tracker (red) and DAPI (blue) were used to stain lysosomes and nucleus respectively and to monitor the co-localization of NE in SKOV3 cells.
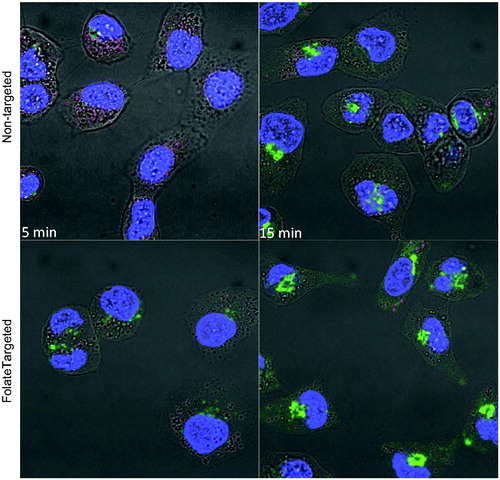
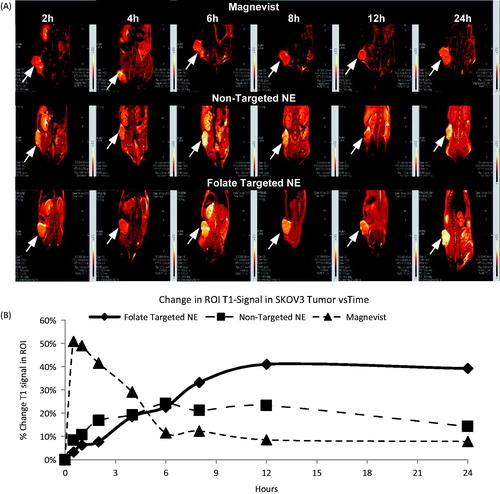
Figure 7. P-glycoprotein expression in SKOV3, SKOV3TR cells using western blot analysis. Lane 1: SKOV3 cells (20 µg protein lysate), Lane 2: SKOV3TR cells (20 µg protein lysate). β-actin was used as a loading control.
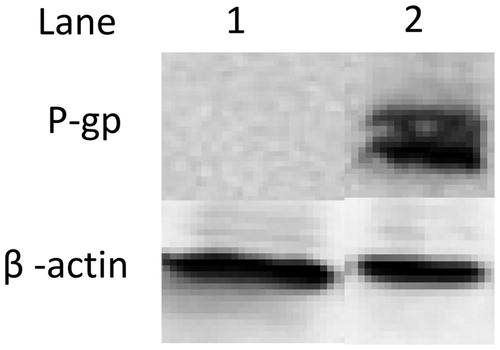
Table 3. IC50 values.
Figure 8. Caspase 3/7 activity assay in (A) SKOV3 and (B) SKOVTR cells treated with DTX in non-targeted NE (DTX-NE (NT)) and folate targeted NE (DTX-NE (Folate)), relative to DTX solution (DTX Sol). The data are shown as mean ± SD (n = 2).
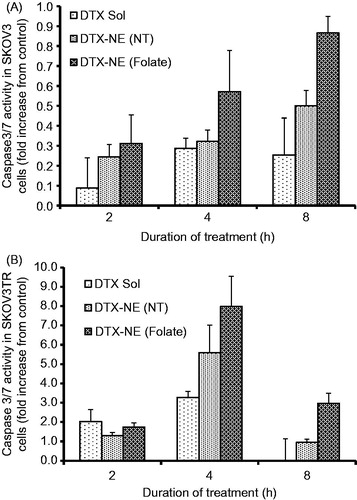
Figure 9. (A)T1 weighted images and (B) quantitative analysis of % tumor signal versus time of mice bearing subcutaneous SKOV3 tumor xenograft post i.v. injection of magnevist, non-targeted NEs and folate-targeted NEs with pemetrexed treatment at final concentration of Gd at 0.072 mmoles/kg, the data are shown as mean ± SD (n = 3).