
Figures & data
Table 1. Characteristics of thermosensitive CS/β-Gp solutions.
Figure 1. Turbidity changes by time for chitosan solutions incubated at 37 °C in the absence of β-Gp (diamonds) and in the presence of β-Gp (squares).
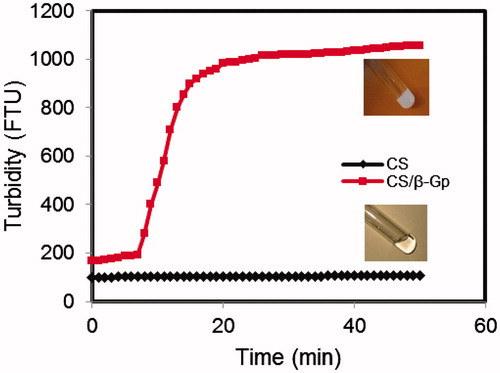
Figure 2. Storage (G′) and loss (G′′) moduli changes for CS/β-Gp solution (CS 2% w/v) over time at 37 °C: (a) β-Gp 8% (w/v) and (b) β-Gp 14% (w/v).
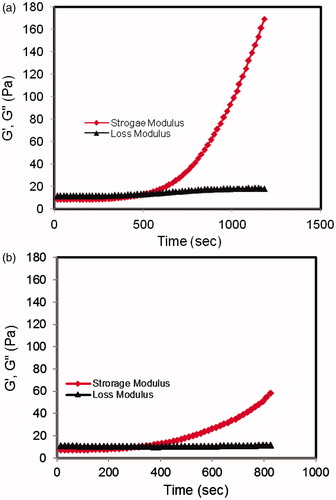
Figure 3. Insulin release profiles from hydrogels prepared with different concentrations of β-Gp [CS 2% (w/v), insulin 0.3 mg/ml]. Data are mean ± SD (n = 3).
![Figure 3. Insulin release profiles from hydrogels prepared with different concentrations of β-Gp [CS 2% (w/v), insulin 0.3 mg/ml]. Data are mean ± SD (n = 3).](/cms/asset/790ca7c7-2511-40a9-8381-6a860d8b0524/idrd_a_932861_f0003_c.jpg)
Figure 4. Extrinsic fluorescence at λex = 370 nm and λem = 400–550 nm of (a) ANS, (b) pure insulin and (c) insulin in Formulation 1.
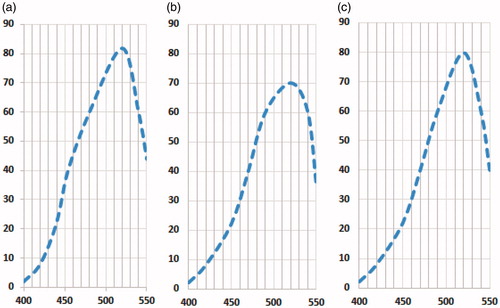
Table 2. Characteristics and kinetic profile of insulin-loaded CS/β-Gp hydrogels.
Figure 5. Blood glucose profiles after subcutaneous dorsal injection of CS/β-Gp/insulin with different insulin concentrations into (a) normal mice [CS 2% (w/v), β-Gp 8% (w/v)] (b) diabetic mice [CS 2% (w/v), β-Gp 8% (w/v), insulin 0.01 mg/ml]. Data are mean ± SD (n = 4).
![Figure 5. Blood glucose profiles after subcutaneous dorsal injection of CS/β-Gp/insulin with different insulin concentrations into (a) normal mice [CS 2% (w/v), β-Gp 8% (w/v)] (b) diabetic mice [CS 2% (w/v), β-Gp 8% (w/v), insulin 0.01 mg/ml]. Data are mean ± SD (n = 4).](/cms/asset/42c0a662-c34f-4971-9532-05ed05daa771/idrd_a_932861_f0005_c.jpg)
Figure 6. Effect of CS/β-Gp/insulin system on blood enzyme level 1-week post-injection after subcutaneous dorsal injection into mice [CS 2% (w/v), β-Gp 8% (w/v), insulin 0.01 mg/ml]: (a) ALP, (b) amylase, (c) AST and (d) CPK. Data are mean ± SD (n = 4).
![Figure 6. Effect of CS/β-Gp/insulin system on blood enzyme level 1-week post-injection after subcutaneous dorsal injection into mice [CS 2% (w/v), β-Gp 8% (w/v), insulin 0.01 mg/ml]: (a) ALP, (b) amylase, (c) AST and (d) CPK. Data are mean ± SD (n = 4).](/cms/asset/b0a70a1a-f5be-4369-8ce4-3d038f16934e/idrd_a_932861_f0006_b.jpg)