Figures & data
Table 1. Optimization of placebo NPs (PNIPAM-NPs) on the basis of NIPAM, VP, AA and MBA ratio.
Figure 1. Comparative SEM (left) and TEM (right) images of (A and D) PNIPAM-CUR, (B and E) PNIPAM-DMC and (C and F) PNIPAM-BDMC.
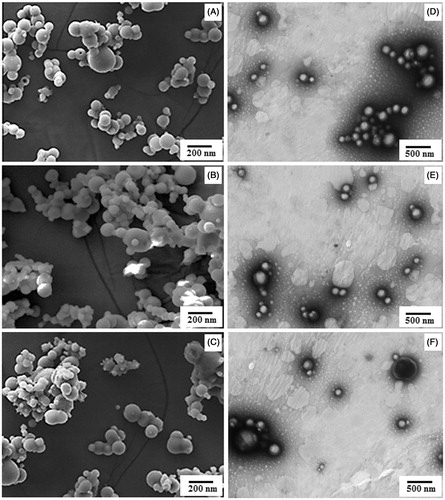
Table 2. Optimization of drug polymer ratio of CUR-PNIPAM, DMC-PNIPAM and BDMC-PNIPAM on the basis of particle size, PDI, zeta potential, PY, LC and EE (%).
Figure 2. NMR spectra of the developed co-poly-(NIPAM–VP–AA) revealing the formation of PNIPAM.
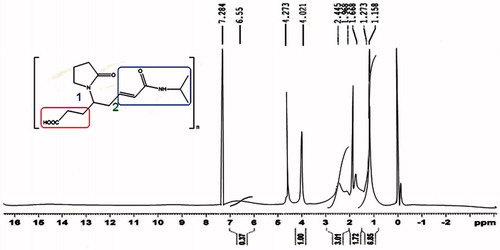
Figure 3. DSC thermograms of pure CUR, DMC and BDMC, physical mixtures of monomers and curcuminoids and freeze-dried NPs.
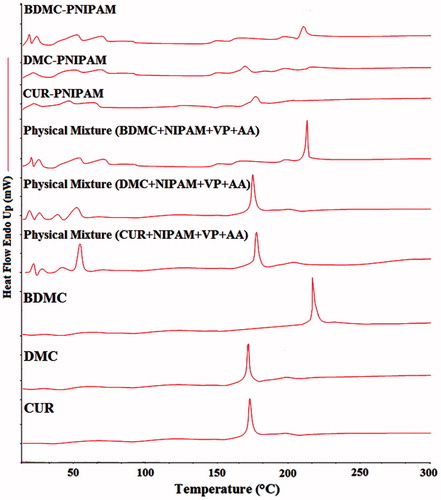
Figure 4. The cumulative percentage release of CUR, DMC, BDMC from CUR-PNIPAM, DMC-PNIPAM and BDMC-PNIPAM (drug:polymer ratio 10:1) as compared to pure CUR, DMC and BDMC.
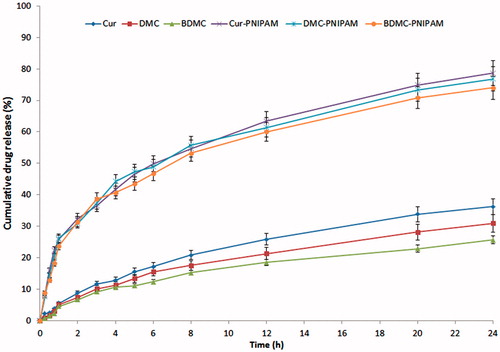
Figure 5. Ex vivo permeation profiles of developed NPs as compared to pure curcuminoids through goat nasal mucosa.
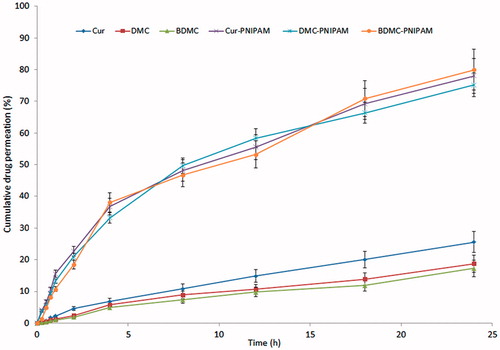
Figure 6. MS and MSMS scans of CUR, DMC, BDMC and IS (nimesulide).
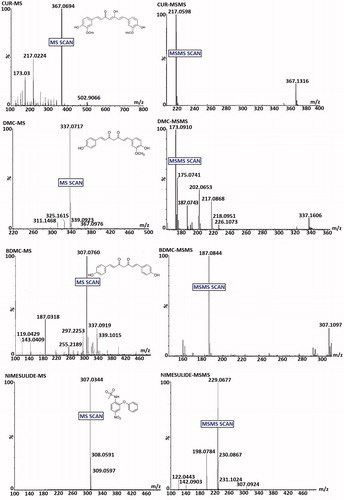
Figure 7. Typical chromatograms of brain homogenate extracted (A) CUR, (B) DMC, (C) BDMC, (D) Blank and (E) Nimesulide (IS).
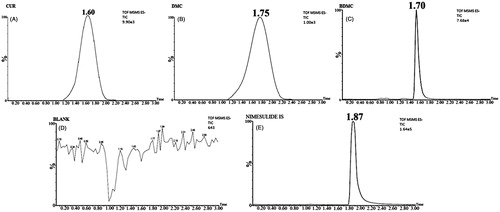
Table 3. Validation: precision and accuracy data for CUR in different biomatrixes.
Table 4. Validation: precision and accuracy data for DMC in different biomatrixes.
Table 5. Validation: precision and accuracy data for BDMC in different biomatrixes.
Table 6. Validation: stability data for CUR in different biomatrixes.
Table 7. Validation: stability data for DMC in different biomatrixes.
Table 8. Validation: stability data for BDMC in different biomatrixes.
Figure 8. Pharmacokinetic profiles of CUR, DMC and BDMC concentration in brain at different time intervals after administration of developed NPs compared with pure curcuminoids.
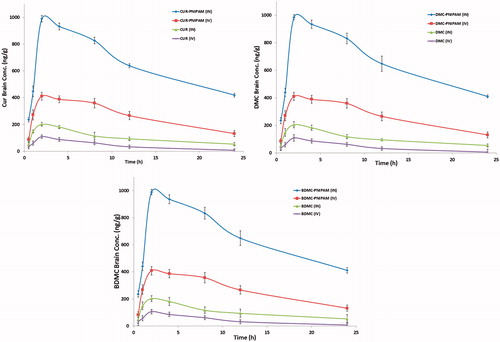
Table 9. Pharmacokinetic parameters of CUR-PNIPAM after i.n. and i.v. administration to rats at the dose of 0.100 mg kg−1 in brain, lungs and plasma (n = 6, mean ± SD).
Table 10. Pharmacokinetic parameters of DMC-PNIPAM after i.n. and i.v. administration to rats at the dose of 0.100 mg kg−1 in brain, lungs and plasma (n = 6, mean ± SD).
Table 11. Pharmacokinetic parameters of BDMC-PNIPAM after i.n. and i.v. administration to rats at the dose of 0.100 mg kg−1 in brain, lungs and plasma (n = 6, mean ± SD).
Table 12. Drug targeting efficiency and direct nose-to-brain transport following i.n. administration of different formulations.
Figure 9. CUR-PNIPAM, DMC-PNIPAM and BDMC-PNIPAM pre-treatment for 21 days improves performances in the neurological deficits after stroke: (A) neurological scores and (B and C) quantification of TNF-α and IL-1β activity by ELISA in the sham, MCAO and CUR-PNIPAM, DMC-PNIPAM and BDMC-PNIPAM + MCAO groups. [***p < 0.001 (Sham vs MCAO); ##p < 0.01 and ###p < 0.001 (Treatment vs MCAO group)].
![Figure 9. CUR-PNIPAM, DMC-PNIPAM and BDMC-PNIPAM pre-treatment for 21 days improves performances in the neurological deficits after stroke: (A) neurological scores and (B and C) quantification of TNF-α and IL-1β activity by ELISA in the sham, MCAO and CUR-PNIPAM, DMC-PNIPAM and BDMC-PNIPAM + MCAO groups. [***p < 0.001 (Sham vs MCAO); ##p < 0.01 and ###p < 0.001 (Treatment vs MCAO group)].](/cms/asset/e15b230b-3624-4878-b6e7-400d77db869e/idrd_a_941076_f0009_b.jpg)
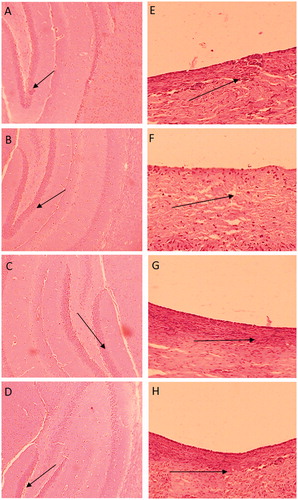
Figure 10. Representative photomicrographs showing the TS of rats' brain (A, B, C and D) and nasal mucosa (E, F, G and H) for normal control, PNIPAM-NPs (placebo), CUR-PNIPAM, DMC-PNIPAM and BDMC-PNIPAM-treated groups, respectively after 14 days.