Figures & data
Table 1. Comparison on several types of subcutaneous infusion devices.
Figure 1. Schematic representation of the osmotic tablet-controlled infusion system.
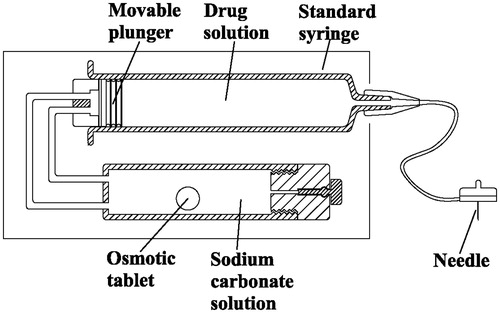
Figure 2. Diagram of the infusion flow measurement.
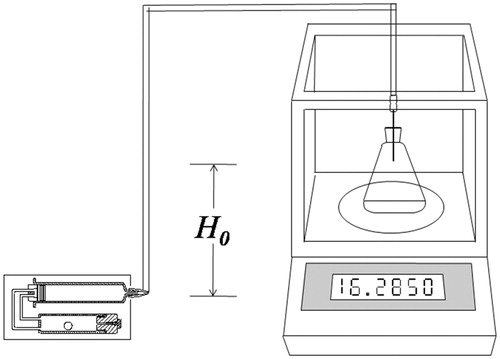
Table 2. The formulation of core tablets.
Table 3. Coating formulation and tablet weight gain.
Figure 3. Influence of the osmotic agents on the infusion flow (n = 6). For tartaric acid and citric acid osmotic tablets, the reaction solution was 5 mg/mL NaHCO3; and for Na2CO3 and NaHCO3 tablets, the reaction solution was 15 mg/mL citric acid. 1* Significant smaller (p < 0.05) when compared with group Na2CO3 and NaHCO3; 2* Significant smaller (p < 0.05) when compared with group NaHCO3; 1△ Significant smaller (p < 0.05) when compared with group Na2CO3 and NaHCO3; 2△ Significant smaller (p < 0.05) when compared with group versus NaHCO3.
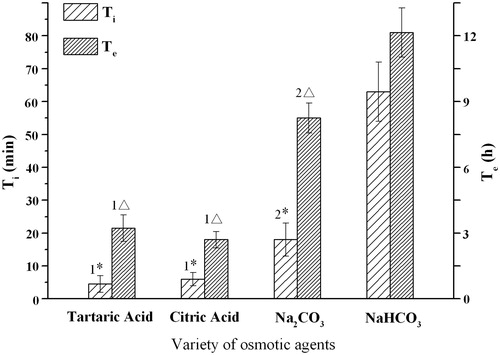
Figure 4. Influence of adhesive agents on the infusion flow (n = 6). 1* Significant smaller (p < 0.05) than group HPC and greater (p < 0.05) than group PVP; 2* Significant smaller (p < 0.05) when compared with group HPC, HPMC and CMC; 1△ Significant smaller (p < 0.05) when compared with group CMC; 2△ Significant smaller (p < 0.05) when compared with group HPMC and CMC.
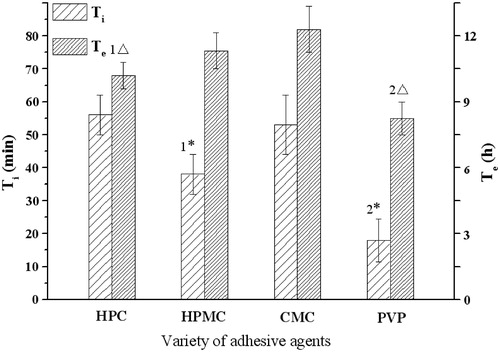
Figure 5. Influence of the amount of PVP on the infusion flow (n = 6). *Significant smaller (p < 0.05) when compared with 3% and 4% PVP; △Significant greater (p < 0.05) when compared with 3% and 4% PVP.
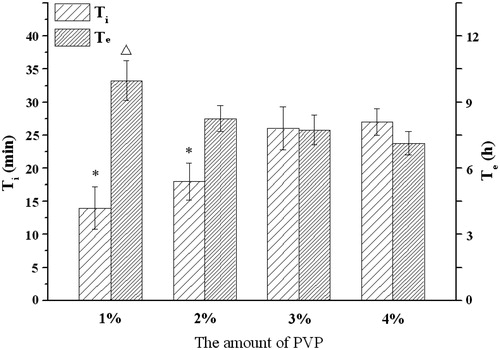
Figure 6. Influence of the PEG on the infusion flow (n = 6). *, △Significant smaller (p < 0.05) when compared with PEG4000 and PEG6000.
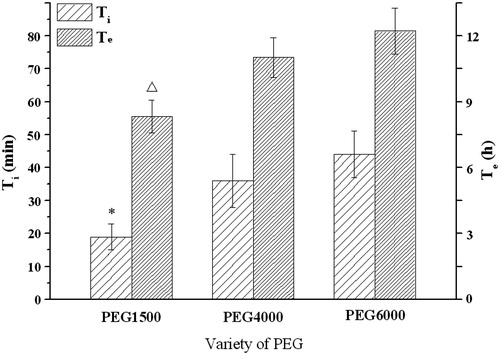
Figure 7. Influence of the level of PEG1500 on the infusion flow (n = 6). *Significant smaller (p < 0.05) when compared with other groups; △Significant greater (p < 0.05) when compared with 2.0%, 2.5% DEP.
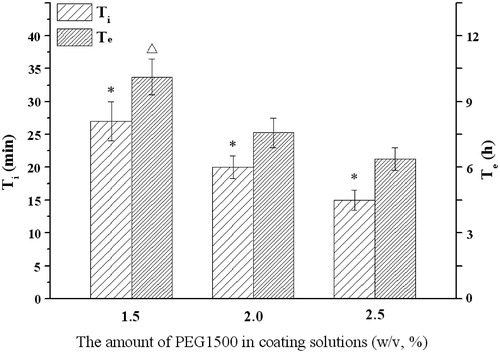
Figure 8. Influence of the amount of DEP on the infusion flow (n = 6). *Significant smaller (p < 0.05) when compared with other groups.
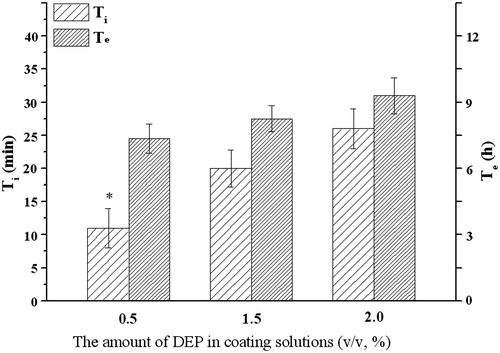
Figure 9. Influence of weight gain of tablet on the infusion flow (n = 6). *, △ Significant smaller (p < 0.05) when compared with weight gain of 15%.
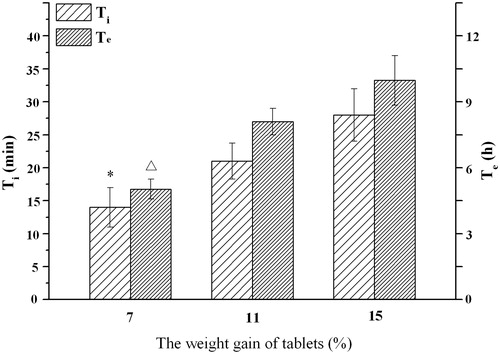
Figure 10. Temperature effect on the infusion profiles of drug delivery system (n = 6). The same data with error bars (Mean ± SD) was shown in the imbedded figure.
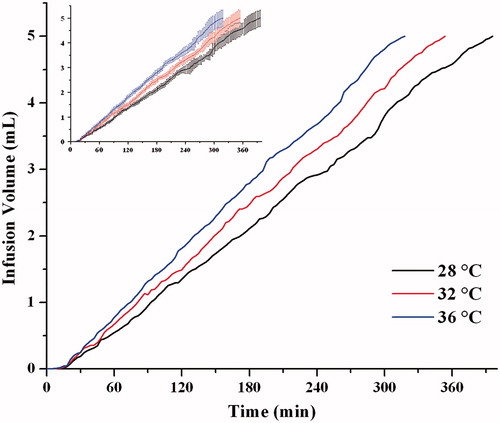
Figure 11. The effect of resistance pressure on the infusion profiles (n = 6). The same data with error bars (Mean ± SD) was shown in the imbedded figure.
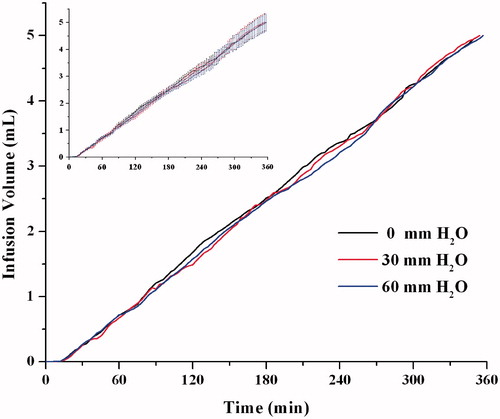
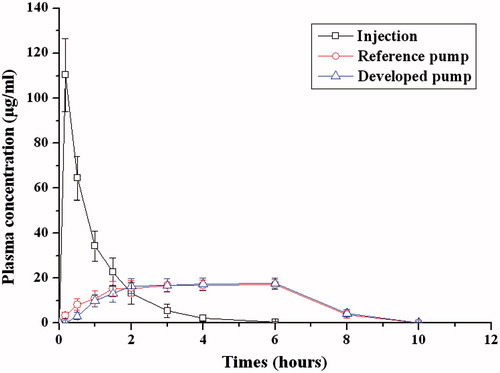
Figure 12. Mean plasma ampicillin concentration-time profiles (n = 6).