Figures & data
Table 1. Possibility of forming beads using different oils and natural cyclodextrins combinations.
Figure 1. Schematic presentation of the successive steps involved in beads preparation.
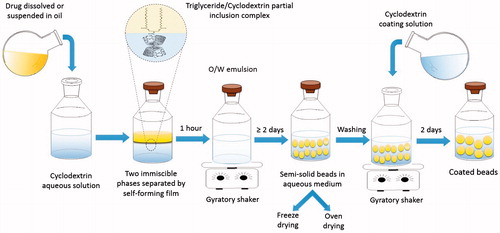
Table 2. Characteristics of drug loaded freeze-dried beads formed of soybean oil and α-cyclodextrin.
Table 3. Comparison between the characteristics of uncoated oven-dried beads and freeze-dried beads.
Figure 2. Scanning electron micrograph of freeze-dried beads (modified from Bochot et al., Citation2007).
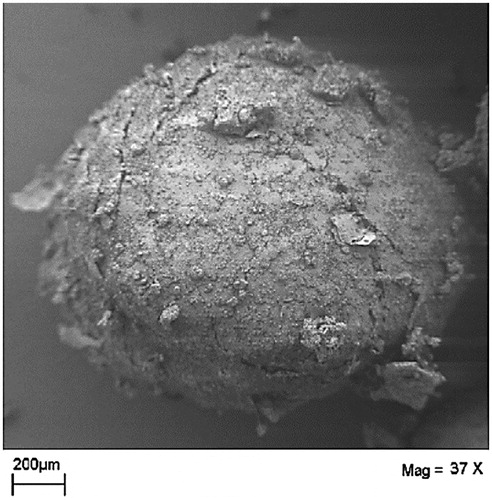
Figure 3. Confocal micrographs of (A) fresh beads with calcein and (B) fresh beads with Nile red (C) microdroplets of oil released from Nile red-loaded beads (Bochot et al., Citation2007; Hamoudi et al., Citation2011).
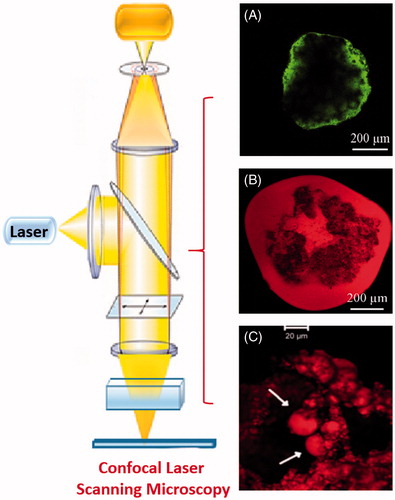
Figure 4. (Diagram A; Bochot et al., Citation2007) X-ray diffraction spectra of (1) fresh beads, (2) freeze-dried beads, (3) inclusion complex of triolein with α-CD, (4) inclusion complex of trilinolein with α-CD, and (5) Complex of trilinolenin with α-CD. (Diagram B; Trichard et al., Citation2011) X-ray diffraction spectra of (1) sweet almond oil beads, (2) soybean oil beads, (3) soybean oil + oleic acid 0.5%, (4) 2.0%, (5) 5.0%, (6) borage oil formulation, and (7) oleic acid/α-CD inclusion complexes. (Diagram C; Trichard et al., Citation2008b) X-ray diffraction spectra of (1) Soybean oil/α-CD beads, (2) Marcol 82/α-CD beads, (3) α-CD, (5) Silicon 50cSt/γ beads, and (5) γ-CD.
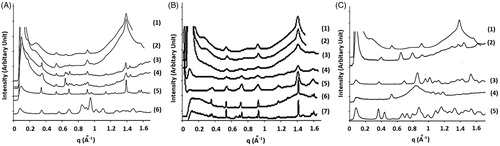
Figure 5. Illustrations of cyclodextrins orientation in dimers within the partial inclusion complex of (A) triglycerides in vegetable oils with α-CD, (B) linear saturated hydrocarbon chains in paraffin oils with α-CD and, (C) linear polydimethylsiloxanes in silicone oils with γ-CD.
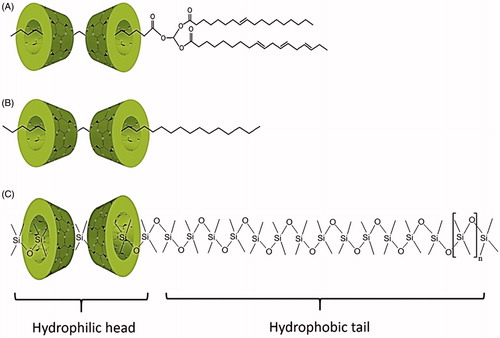
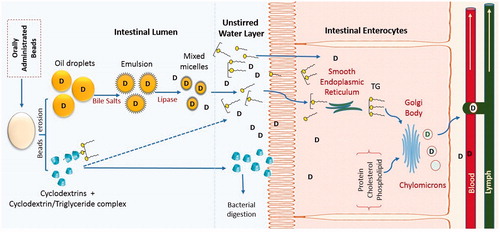
Figure 6. Potential behavior of oil-cyclodextrin beads after oral administration (Based on Hamoudi et al., Citation2011).
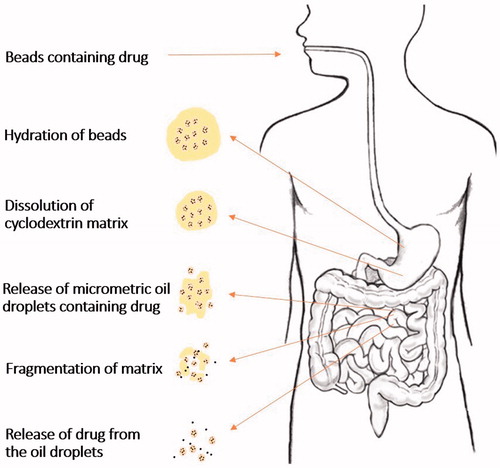
Figure 7. Schematic diagram of mechanisms of intestinal drug absorption from beads.