Figures & data
Figure 1. SEM images of (A) PBCA (drug-free) and (B) EPI-PBCA (drug-loaded) nanoparticles (scale bar represents 0.5 μm).
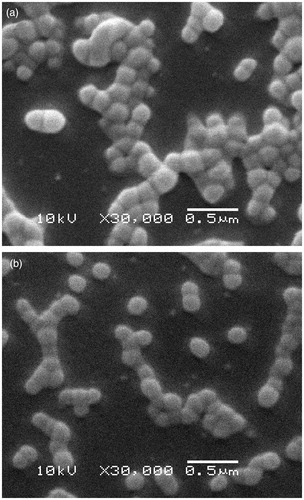
Figure 2. MTT analysis for cytotoxicity of free EPI and PBCA-loaded epirubicin on HeLa cells. **p < 0.01 and ***p < 0.001.
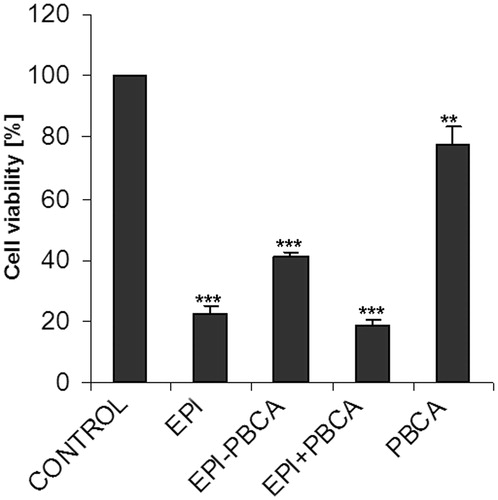
Figure 3. Uptake of epirubicin formulations by HeLa cells. (A) Representative images of epirubicin treated cells. Left column represents phase contrast (PhC) images overlaid with the fluorescent signal. Right column shows the fluorescent images only. Arrows indicate predominant nuclear localization, arrowheads indicate predominant cytoplasmic localization. Scale bar: 50 µm. (B) Uptake of epirubicin formulations by HeLa cells. Graph indicates the average mean gray value per cell, measured with ImageJ software. ***p < 0.001.
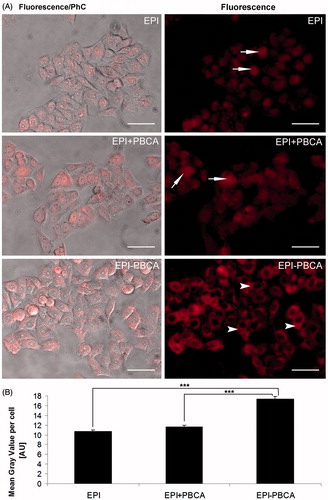
Figure 4. Acridine orange staining for endosomal and lysosomal vesicles. (A) Fluorescent images of control and PBCA-treated HeLa cells. Arrows indicate red/orange stained endosomal/lysosomal vesicles. Scale bar: 20 µm. (B) Graph represents average area of endosomal vesicles per cell, measured with ImageJ software. (C) Representative TEM image shows PBCA nanoparticles engulfed in endosomes. Scale bar: 100 nm. Labels: NP, nanoparticle; v, vesicle. (D) Graph represents average area of endosomal vesicles per cell in fluorescent images of PBCA-treated cells, measured with ImageJ software.
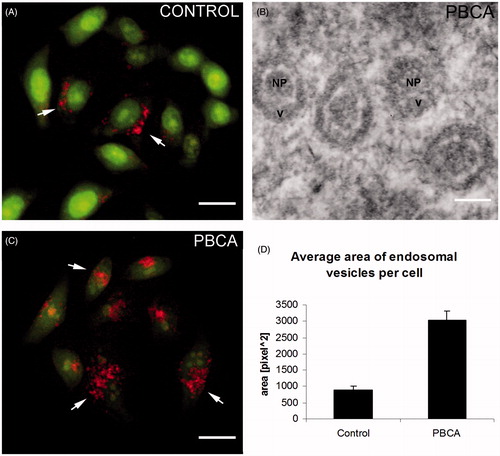
Figure 5. TEM images of untreated HeLa cells (control) and HeLa cells treated with free EPI, EPI + PBCA or EPI − PBCA formulations. Arrows indicate PBCA nanoparticles in endosomal/lysosomal vesicles. Insets represent single vesicles. Labels: N, nucleus; C, cytoplasm. Scale bar: 200 nm.
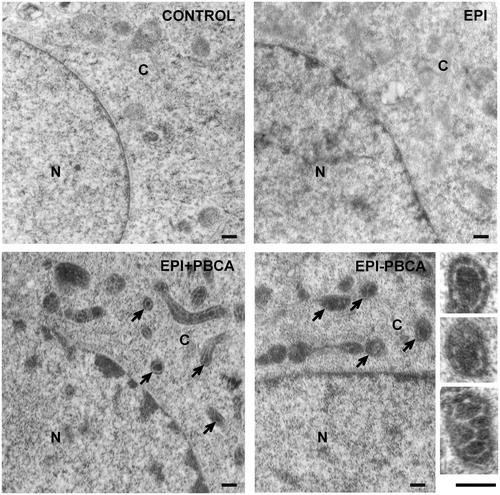
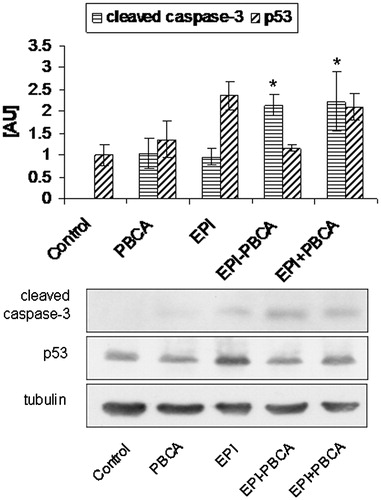
Figure 6. Western blot analysis of cervical tumor cells treated with epirubicin formulations. Graph shows results from densitometric analysis of Western blots probed for activated caspase-3 and p53. Tubulin was used as internal control for loading. Representative blots are shown. *p < 0.5.