Figures & data
Table 1. Effect of adding different concentrations of ethanol in 0.9% saline on nebulization rate/min and nebulized fraction (mean ± S.D., n = 6).
Table 2. Andersen cascade impactor (ACI) results for AS nebulization with and without spacer at inspiratory flow rate of 28.3 L min−1 (n = 6).
Table 3. Signs and symptoms of atropinization in human volunteers after inhalation of submicronic 3% AS respiratory fluid (n = 6).
Figure 1. Plasma concentrations of 3% nano-AS in human volunteers post-nebulization (mean ± S.D., n = 6).
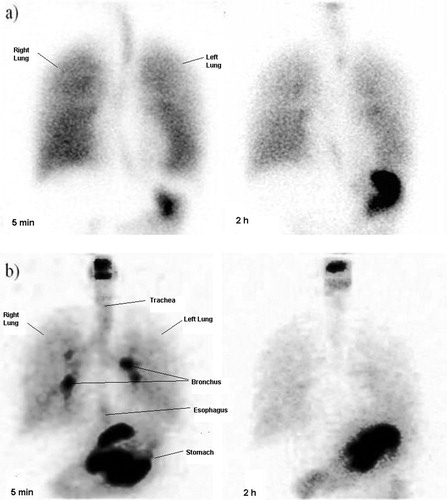
Figure 2. Human scintigraphy images of submicronic 3% AS respiratory formulation in two healthy volunteers at 5 min and 2 h showing distribution of the drug into oral cavity, tracheobronchial tree, lungs and stomach. While (a) represents distribution of nebulized drug using a spacer, (b) represent distribution of drug without a spacer.