Figures & data
Figure 1. Effect of pH on the intranasal absorption of SMS (n = 3).
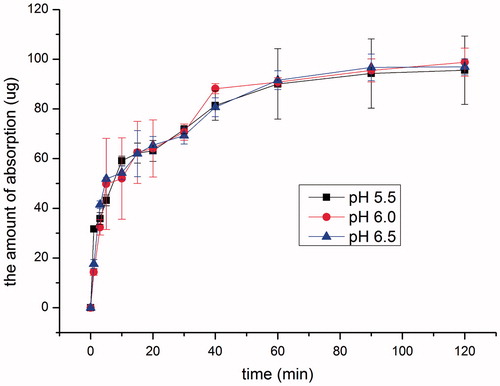
Figure 2. Effect of drug concentration on the intranasal absorption of SMS (n = 3).
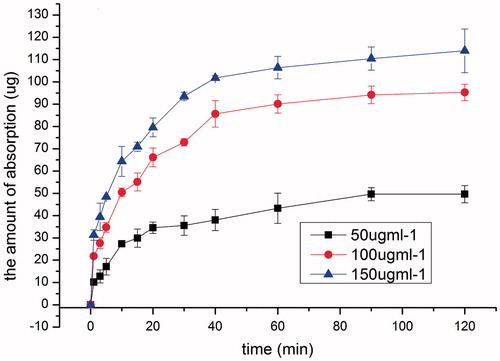
Figure 3. Effect of poloxamer188 concentration on the intranasal absorption of SMS (n = 3).
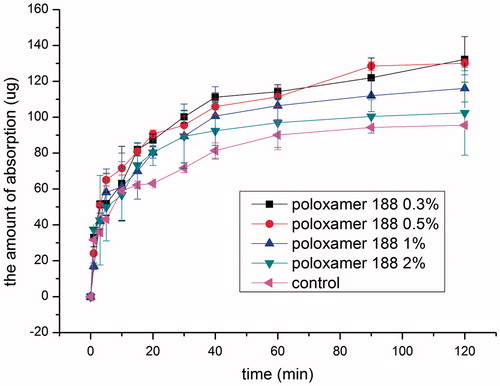
Figure 4. Effect of cremophor EL concentration on the intranasal absorption of SMS (n = 3).
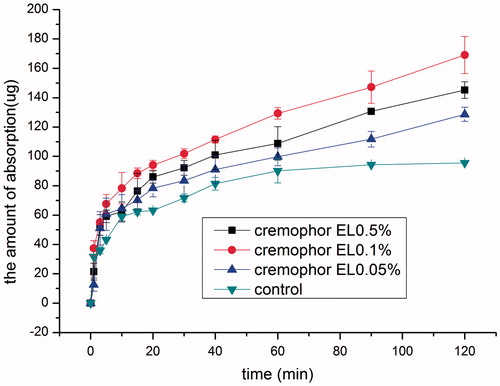
Figure 5. Effect of laurate SE concentration on the intranasal absorption of SMS (n = 3).
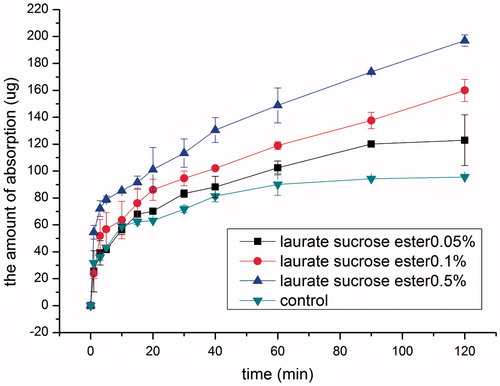
Figure 6. Comparison of different absorption enhancers on intranasal absorption of SMS (n = 3).
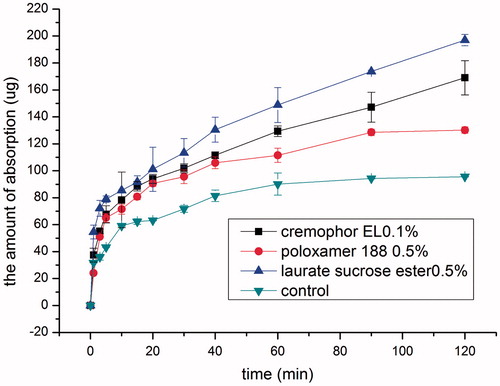
Figure 7. Relative inhibition rate of different absorption enhancers (n = 3).
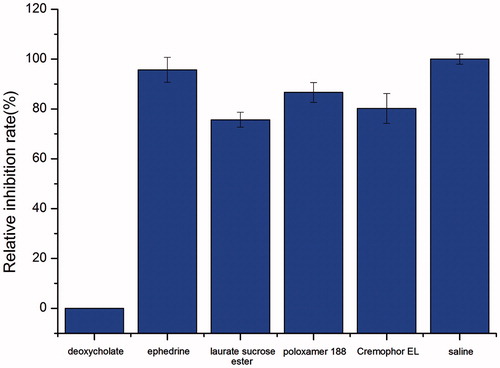
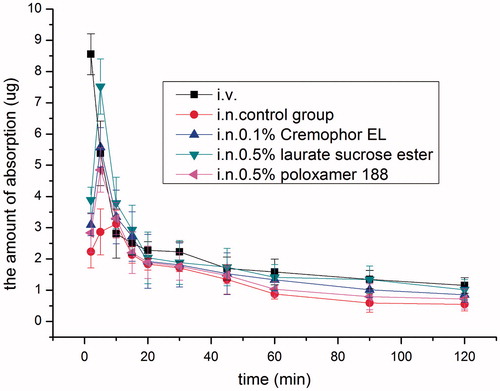
Figure 8. Mean plasma concentration–time profiles after intranasal application of SMS containing 0.5% laurate SE, 0.5% poloxamer 188 and 0.1% cremophor EL, respectively, in rats, compared with the intranasal control group (15 mgkg−1) and intravenous injection group (3 mgkg−1). Indicated values are the mean of five experiments (n = 5).