
Figures & data
Scheme 1. Synthesis of MTX-LYS. Reagents and conditions: (i) NaOH, 1,4-Dioxane-Water, (BOC)2O, stir at room temp., 20 h; (ii) Anhydrous DMF, DCC, Ethyl Acetate, stir at 0 °C for 2 h, MTX stir at room temp. for 24 h; (iii) TFA, Anhydrous DMF, stir at room temp., 1.5 h.
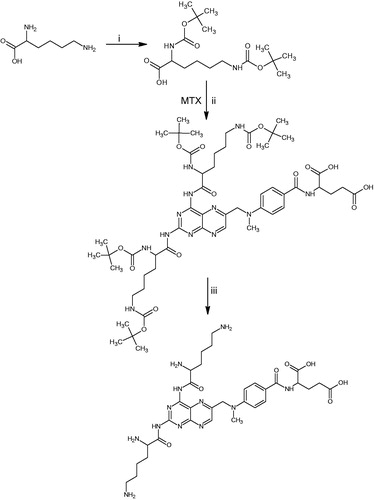
Table 1. Stability studies in different buffer solutions.
Table 2. Metabolic stability in plasma extracts and brain homogenate.
Figure 1. Release of the MTX by MTX-LYS in brain homogenate. Values are expressed as mean ± SD (n = 3).
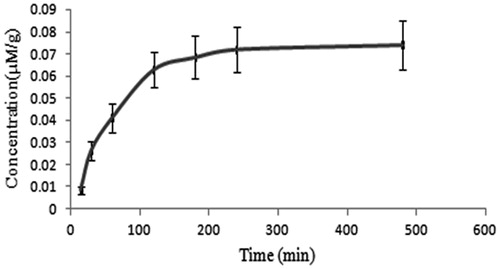
Figure 2. Percent hemolysis with MTX and MTX-LYS. Values are expressed as mean ± SD (n = 3).
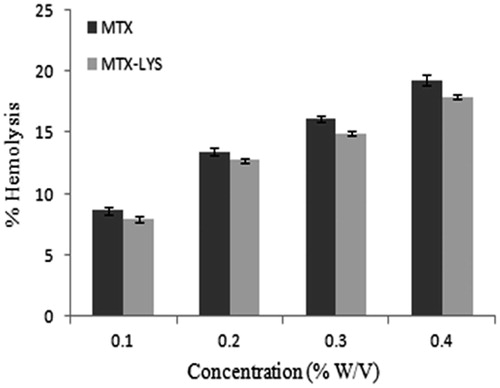
Table 3. Hematological parameters of animals treated with MTX and MTX-LYS conjugate at different doses (25 and 250 mg/kg) after 15 days.
Figure 3. Concentration curve of MTX in brain after administration of MTX and MTX-LYS. Values are expressed as mean ± SD (n = 3).
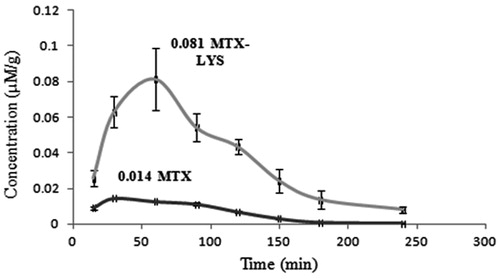
Table 4. Pharmacokinetic parameter of MTX in plasma after administration of MTX and MTX-LYS.
Table 5. Pharmacokinetic parameter of MTX in brain after administration of MTX and MTX-LYS.
Table 6. Radiolabeling of MTX and MTX-LYS.
Table 7. In vitro stability of radiolabeled complexes of MTX and MTX-LYS in saline and plasma at different time intervals.
Table 8. Relative tissue distribution (%) of MTX and MTX-LYS.
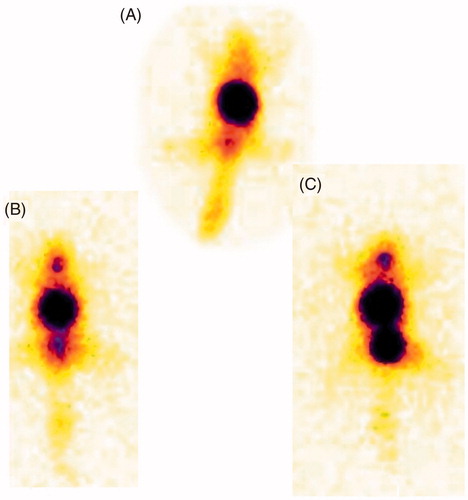
Figure 4. Gamma scintigraphy images of mice (A) MTX after 120 min, (B) MTX-LYS, after 60 min, (C) MTX-LYS after 120 min.
Supplemental material