Figures & data
Figure 1. Amount of l-DOPA formed by hydrolysis of LDME versus time in buffered solutions at pH 7.4 (▴), pH 6.8 ![]()
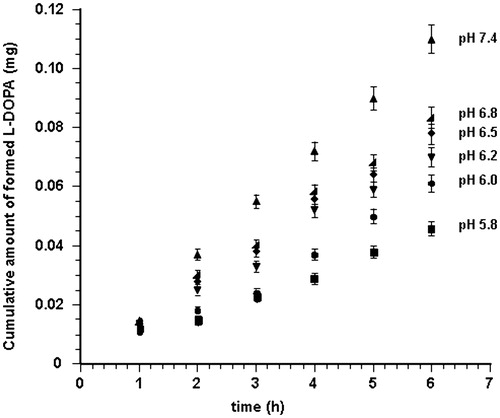
Table 1. Hydrolysis of LDME in absence and in presence of mucosal tissue after six hours of experiments (n = 6).
Figure 2. Cumulative amount of l-DOPA that reaches the receptor phase versus time following delivery of LDME solution (50 mg/mL, 37 ± 0.2 °C) at pH 5.8 (•) and pH 6.2 (▪). Values are presented as mean ± SD (n = 6).
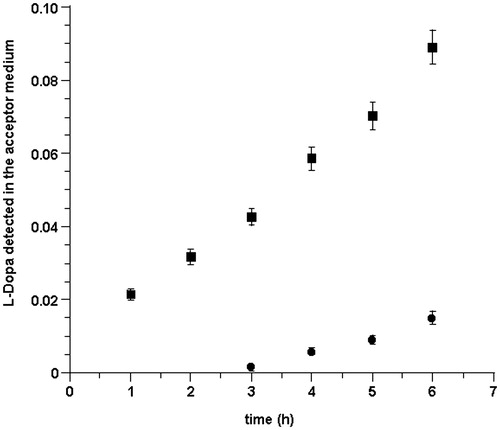
Figure 3. l-DOPA formed in absence (chemical hydrolysis) and in presence (cumulative: chemical plus enzymatic hydrolysis) of mucosal tissue versus time following delivery of LDME solution (50 mg/mL, 37 ± 0.2 °C) at: pH 5.8 chemical (♦); pH 5.8 cumulative (▾); pH 6.2 chemical (▪); and pH 6.2 cumulative (•). Values are presented as mean ± SD (n = 6).
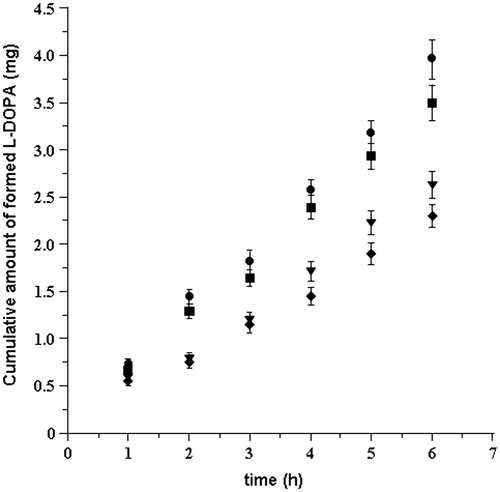
Figure 4. Cumulative amount of drug that reaches the acceptor compartment versus time following delivery of l-DOPA solution (1.5 mg/mL, 37 ± 0.2 °C) at pH 5.8 (♦) and pH 6.2 (▾). Values are presented as mean ± SD (n = 6).
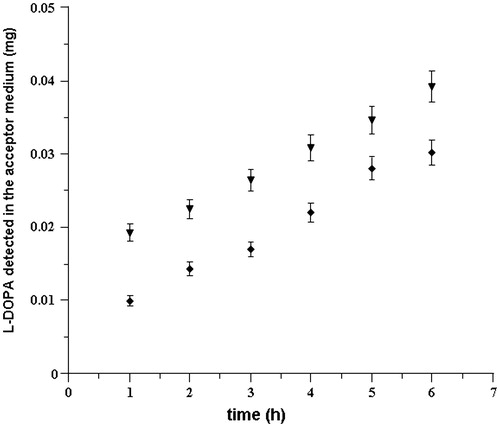
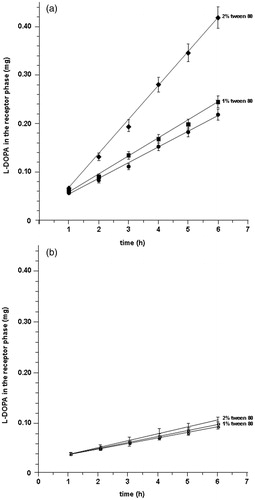
Figure 5. Cumulative amounts of l-DOPA in the acceptor compartment versus time: (a) following delivery of LDME at pH 6.2 in absence of enhancer (•) and in the presence of 1% (▪) and 2% (♦) of Tween 80®. (b) Following delivery of l-DOPA in absence of enhancer (○) and in the presence of 1% (□) and 2% (⋄) of Tween 80®. Values are presented as mean ± SD (n = 6).