Figures & data
Scheme 1. Schematic illustration of drug release from pH-sensitive hydrogel and its application in UC therapy .
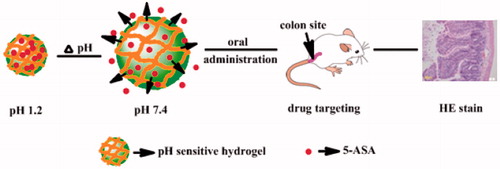
Figure 1. SEM photo of 5-ASA-loaded in P(CE-MAA-MEG) hydrogel.
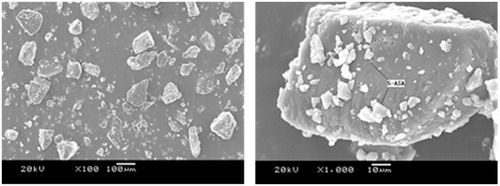
Figure 2. In vitro release of 5-ASA from P(CE-MAA-MEG) hydrogel in different pH value (pH 1.2 and pH 7.4). Data are shown as mean ± S.D.
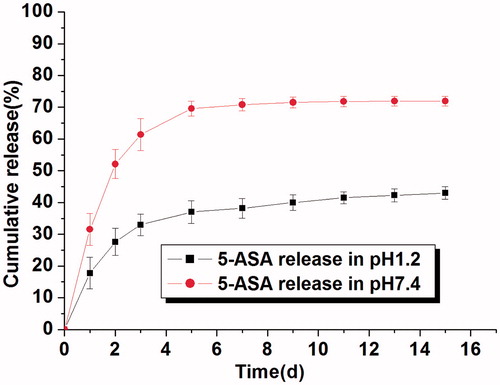
Figure 3. Relative body weight change with time during the whole experimental period always determined for n = 10 mice.
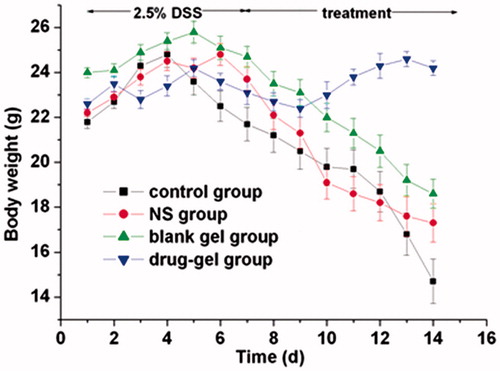
Figure 4. Effects of DSS on colonic DAI score in mice with DSS-induced colitis. Data are means ± SD. n = 10 per group. ##p < 0.01 versus control group; *p < 0.05 versus DSS group; ##p < 0.01 versus DSS + 5-ASA-GEL group. DSS, dextran sodium sulfate; 5-ASA, 5-aminosalicylic acid; 5-ASA-GEL, 5-aminosalicylic acid-loaded hydrogel.
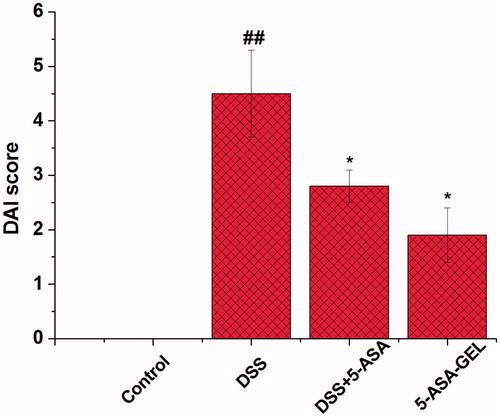
Figure 5. Determination of colon length after final drug administration for n = 10 mice. Data are shown as mean ± S.D.
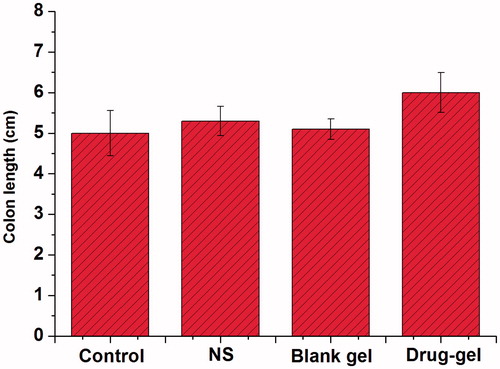
Figure 6. Pathological changes in different colon intestine specimens under light microscope after day 3 and 7 treatment of 5-ASA-GEL.
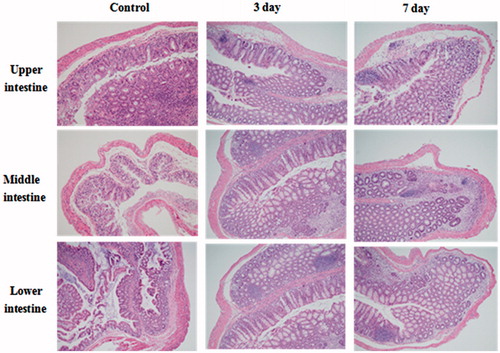
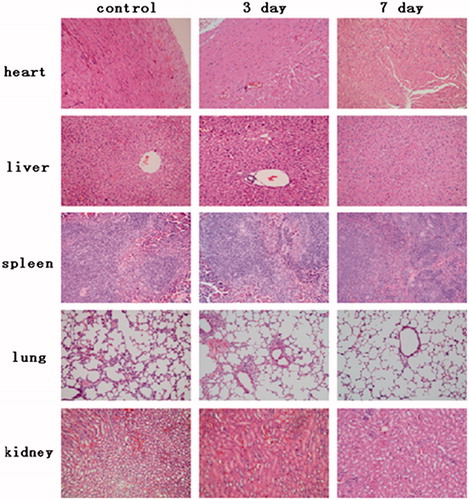
Figure 7. Photogragh of major organs after oral administration of UC treatment of mice (40×). Mice cardiac muscle, liver, spleen, lung and kidneys’ photogragh of control group and P(CE-MAA-MEG) hydrogel treated group, respectively.