Figures & data
Figure 1. The particle size distribution of nanosuspension (n = 3).
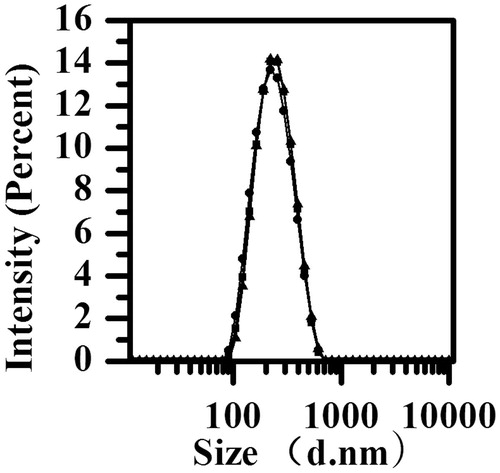
Figure 2. The SEM image of bulk PPD powder and PPD nanosuspensions ((a) PPD powder (× 9000), (b) PPD nanosuspensions (× 9000), and (c) PPD nanosuspensions (× 25 000)).
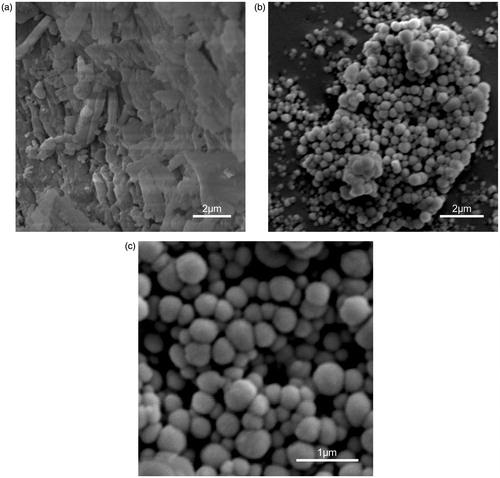
Figure 3. The XRD of PPD nanosuspensions (a), physical mixture of bulk PPD power with BSA (b), bulk PPD power (c), and BSA (d).
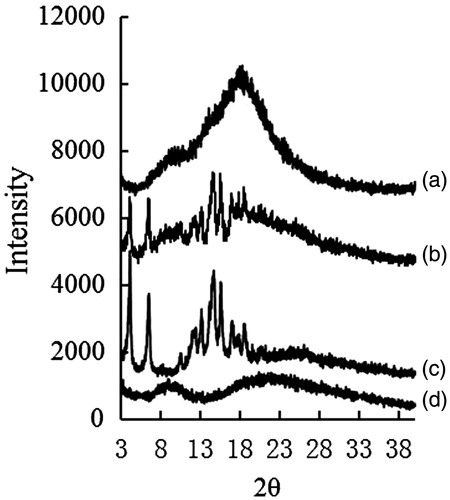
Figure 4. The DSC thermograms of PPD nanosuspensions (a), bulk PPD power (b), BSA (c), and physical mixture of bulk PPD power with BSA (d).
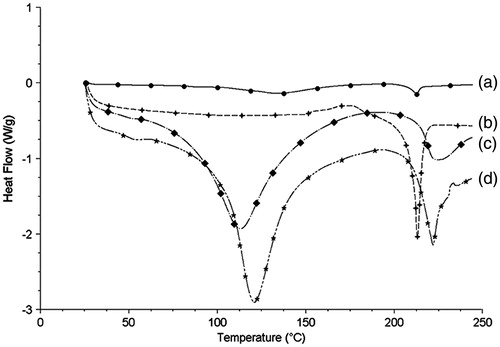
Figure 5. The cytotoxicity of PPD nanosuspensions and PPD solution in the HepG2 cells after 12 h (a), 24 h (b), and 36 h (c) exposure. Results are expressed as mean ± SD (n = 6). *p < 0.05 and **p < 0.01 (nanosuspensions versus solution).
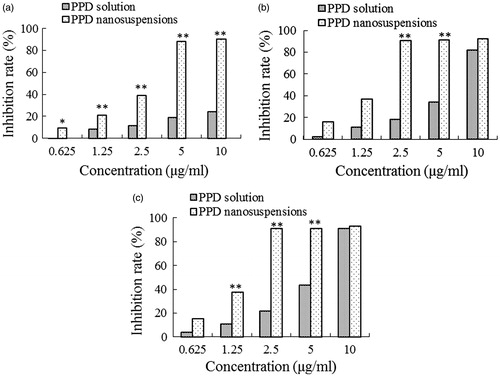
Figure 6. The mean plasma concentration–time curves of PPD in rats after the i.g. administration of the coarse suspensions and nanosuspensions at a single dose of 25 mg/kg of body weight (a) and the i.v. administration of the solution and nanosuspensions at a single dose of 25 mg/kg of body weight (b). Each point with a bar represents the mean ± SD (n = 6).
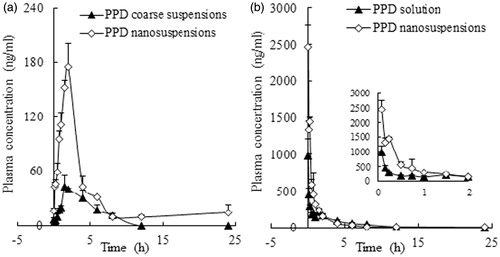
Table 1. Summary of the pharmacokinetic parameters after i.g. administration of two PPD formulations at a dose of 25 mg/kg in rats.
Table 2. Summary of the pharmacokinetic parameters after i.v. administration of two PPD formulations at a dose of 25 mg/kg of body weight in rats.
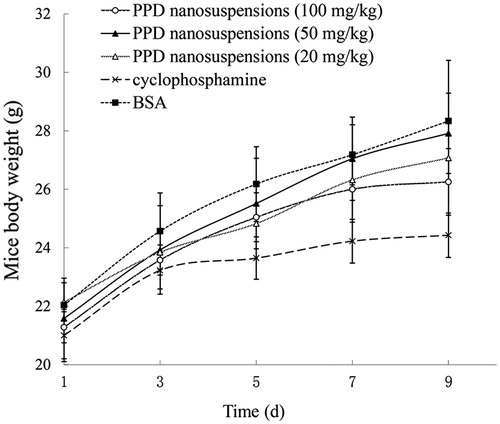
Figure 7. The body weight changes in mice. Each value represents the mean ± SD (n = 8).