Figures & data
Figure 1. Characterization of EGF-dendriplexes: (a) Particle sizes of different complexes with different PAMAM/DNA N/P ratios. The weight ratio of EGF/DNA is 2. (b) Zeta potentials of different complexes with different PAMAM/DNA N/P ratios. The weight ratio of EGF/DNA is 2. (c) Agarose gel retardation assay of different complexes: Lane 1: DNA ladder; Lane 2: plasmid DNA; Lane 3–12: EGF-dendriplexes at PAMAM/DNA charge ratio of 0.05, 0.1, 0.2, 0.5, 1, 2, 5, 10, 20, 30.
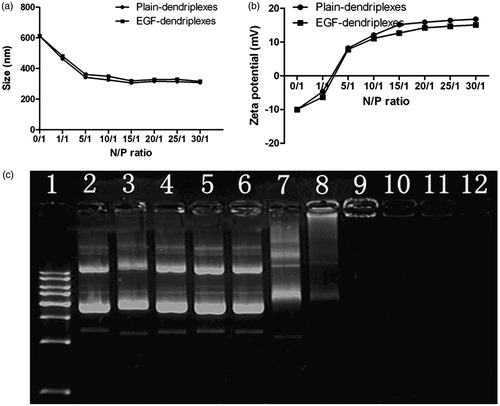
Figure 2. Cytotoxicity of EGF-dendriplexes at EGF/DNA weight ratios of 2 and various N/P ratio. PAMAM concentration within the complexes was 40 μg/mL.
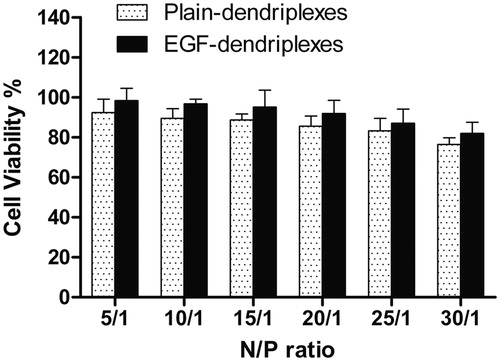
Figure 3. Optimization of N/P ratios and EGF/DNA weight ratios: a. Luciferase expression in HepG2 cells transfected with different complexes with different PAMAM/DNA N/P ratios. The weight ratio of EGF/DNA is 2. b. Luciferase expression in HepG2 cells transfected with different complexes with different EGF/DNA weight ratios. The PAMAM/DNA N/P weight ratio of is 20.
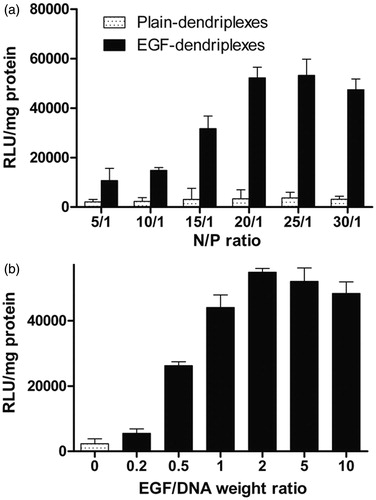
Figure 4. TEM, Zeta potential and size distribution of EGF-dendriplexes at N/P ratio of 20 and weight ratio of EGF/DNA is 2.
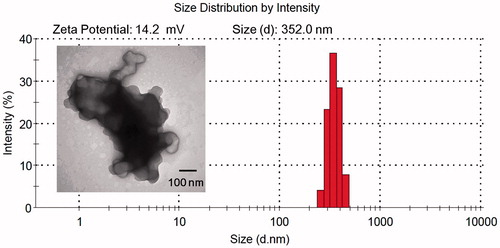
Figure 5. Cellular uptake of EGF-dendriplexes and dendriplexes: (a) Confocal images of HepG2 cells after incubation with Plain-dendriplexes and EGF-dendriplexes. The PAMAM/DNA N/P ratio is 20, and the weight ratio of EGF/DNA is 2. (b) Single typical HepG2 cell treated with Plain-dendriplexes and EGF-dendriplexes. (c) The percentage of cellular uptake of Plain-dendriplexes and EGF-dendriplexes. (d) The mean fluorescence intensity of HepG2 cells treated with plain-dendriplexes and EGF-dendriplexes. *means p < 0.05.
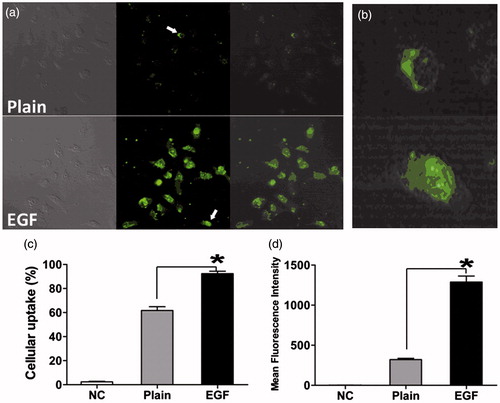
Figure 6. Transfection efficiency of dendriplexes (N/P ratio of 20) and EGF-dendriplexes (N/P ratio of 20, EGF/DNA weight ratio of 2) in Hela and MDA-MB-231 cell lines. * means p < 0.05.
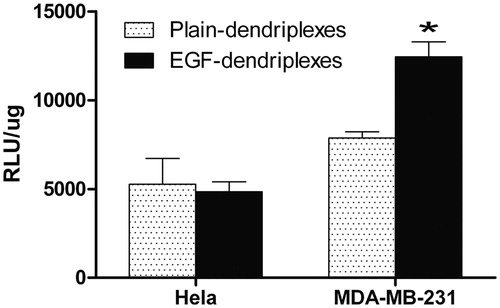
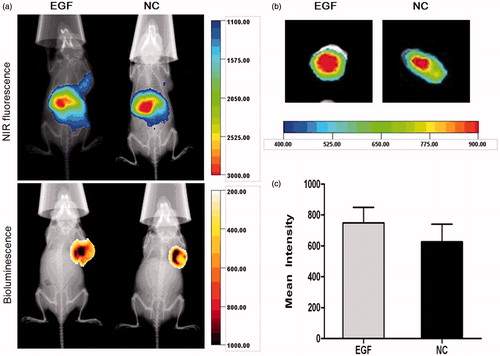
Figure 7. X-ray and in vivo NIR fluorescence overlay images of tumor-bearing mice treated with plain-dendriplexes and EGF-dendriplexes. (a) The location and possible metastasis of MDA-MB-231-luc tumor were determined with bioluminescence by injecting 150 mg/kg d-luciferin. The optical imaging was obtained using Kodak multimodal imaging system FX-Pro equipped with an excitation bandpass filter at 690 nm and an emission at 790 nm. (b) X-ray and ex vivo NIR fluorescence overlay images of tumors treated with plain-dendriplexes and EGF-dendriplexes. (c) Mean ± standard deviation (n = 3) of fluorescence intensity of plain-dendriplexes and EGF-dendriplexes ex vivo.