Figures & data
Figure 1. The chemical structure of glaucocalyxin A.
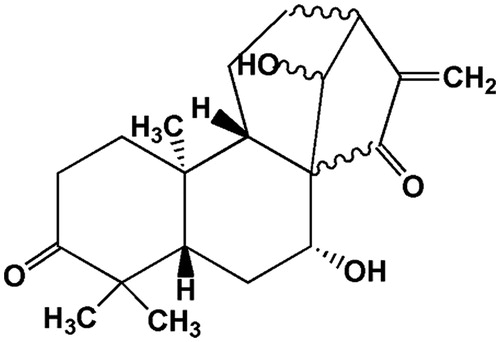
Figure 2. Characterization of GLA nanoparticles. (A) Particle size distribution of GLA nanosuspensions (n = 3); (B) TEM micrograph of GLA nanosuspensions ( × 50 000); (C) DSC thermograms for the freeze-dried GLA nanosuspensions, coarse drug powders, lecithin, and lyophilized powders of fetal calf serum (top to bottom).
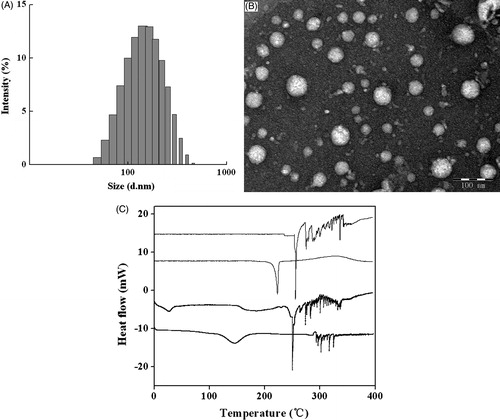
Figure 3. Solubility profiles of the GLA coarse suspensions, GLA nanosuspensions, and GLA solution (n = 3).
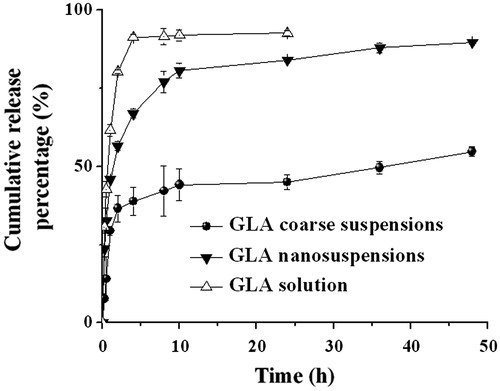
Figure 4. The cytotoxicity of free GLA solution and GLA nanosuspensions on HepG2 cell lines after a 12-h exposure. The results are expressed as the mean ± SD (n = 6). *p < 0.05 (nanosuspensions versus solution).
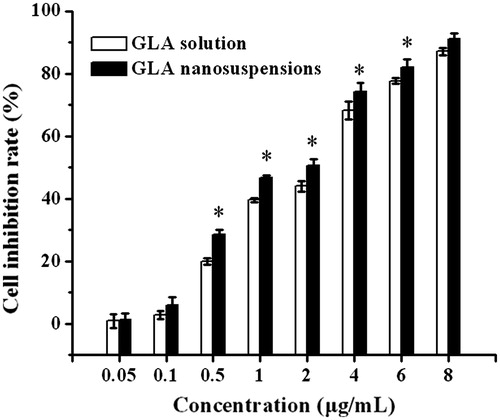
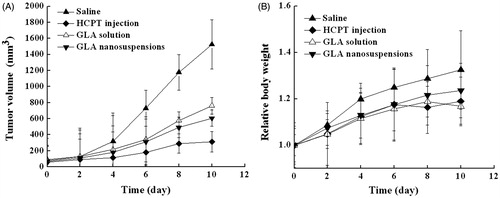
Figure 5. (A) Tumor growth in H22 tumor-bearing mice at 10.0 mg/kg of GLA (n = 6). (B) Relative body weight changes in mice after i.v. administration. The results are expressed as the mean ± SD (n = 6).