Figures & data
Figure 1. RDP-p53 selectively entered into the neuroblastoma cells observed under confocal microscope. HepG-2 and SH-SY5Y cells were first, respectively, incubated with FITC and rhodamine B isothiocyanate (Rho B) labeled p53 and RDP-p53 for 3 h. After washed with PBS three times, cells were stained by DAPI for 30 min and washed again. Magnification 400 × .
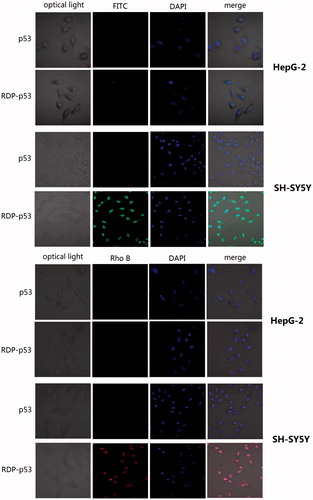
Figure 2. Cell viability of cell growth induced by p53 and RDP-53. (A) The survival rate of RDP, p53, and RDP-p53 on neuroblastoma cells at different reaction times. The final concentration of protein was 100 μg/ml and cells treated with RDP were considered as the control. Data are mean ± SEM (n = 3). *p < 0.05, **p < 0.01, ***p < 0.001. (B) The cell viability of RDP-p53 at different incubation times and different concentrations (n = 3). Cell viability was assessed with the MTT assay.
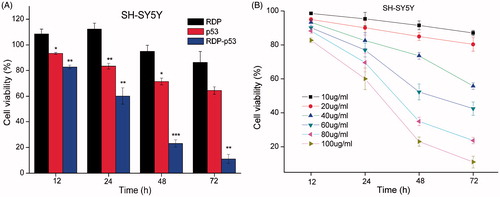
Figure 3. The mechanism of RDP-p53 in SH-SY5Y cells. (A) Strong blue with weak red fluorescence were observed in the apoptotic cells, clearly indicating that p53 showed the ability of inducing cells apoptosis. Original magnification is 100×. (B) Induction of apoptosis on SH-SY5Y cells following PBS, p53, and RDP-p53 treatment. SH-SY5Y cells were treated with protein for 24 h before detected by flow cytometric analysis. (C) Cell-cycle distributions in SH-SY5Y cells with PBS, p53, and RDP-p53 treatment.
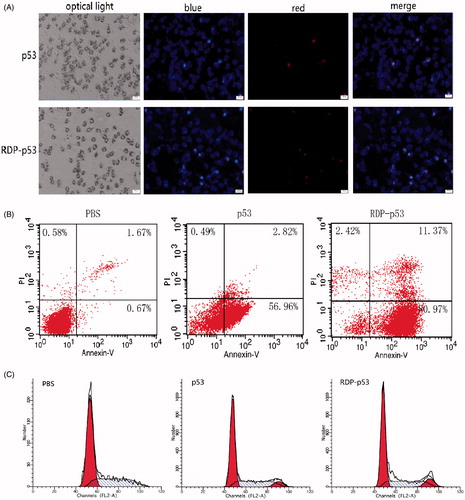
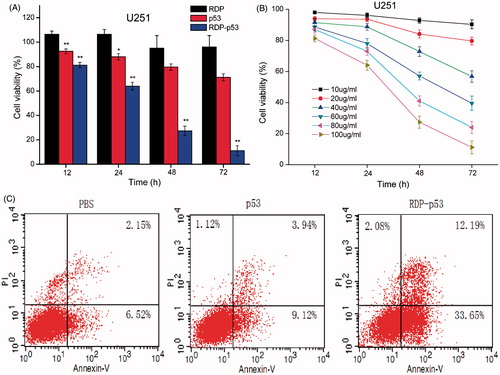
Figure 4. Cell viability of RDP-p53 in U251 cells. (A) The cell survival rate of RDP, p53, and RDP-p53 in U251 cells at different time points. The final concentration of protein is 100 μg/ml and cells treated with RDP were considered as the control. Data are mean ± SEM (n = 3). *p < 0.05, ** p < 0.01. (B) The cell viability of RDP-p53 with a series of concentration and different incubation times (n = 3). Cell viability was assessed with the MTT assay. (C) Induction of apoptosis in U251 cells with PBS, p53, and RDP-p53 treatment. U251 cells were treated with protein for 24 h before analysis by flow cytometry.