Figures & data
Figure 1. Synthetic scheme of FITC conjugated PLGA polymer.
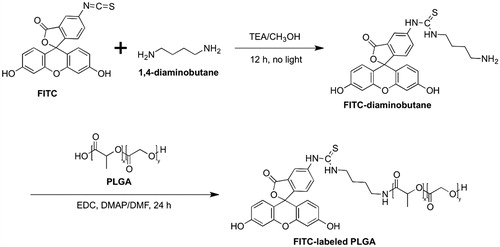
Figure 2. FTIR spectra of (A) PLGA 75:25 and (B) FITC-labeled PLGA 75:25.
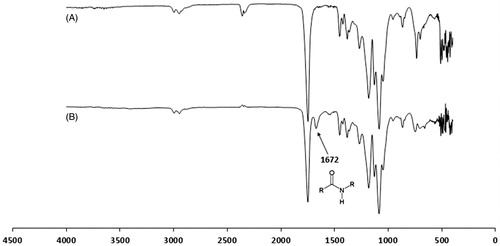
Figure 3. Particle size distribution curves and scanning electron photographs of NP. (A and B) FITC-labeled LLGCV-NP, (C and D) FITC-labeled LDGCV-NP and (E and F) FITC-labeled DLGCV-NP.
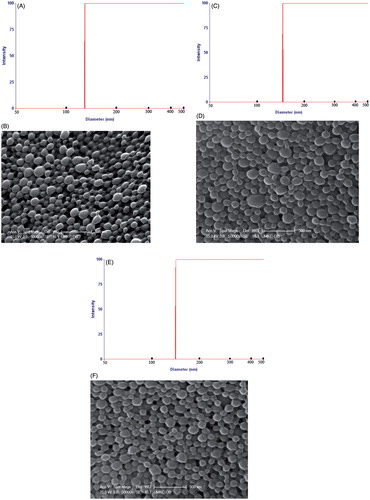
Figure 4. Zeta potential distribution of NP. (A) LLGCV-NP, (B) LDGCV-NP, and (C) DLGCV-NP.
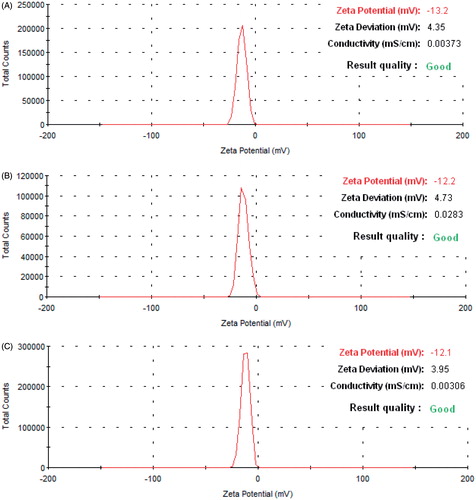
Figure 5. Time-dependent uptake efficiency of (♦) LLGCV-NP, (▪) LDGCV-NP and (▴) DLGCV-NP in HCEC cells. Each data point shown is the average of three samples. Each data point is expressed as mean ± SD (n = 3).
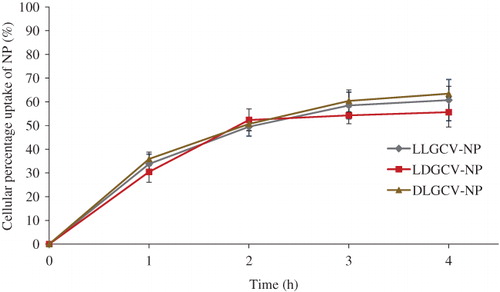
Figure 6. Bioconversion pathway of prodrugs of GCV in HCEC cell homogenate. (A) LLGCV-NP, (B) LDGCV-NP and (C) DLGCV-NP. (♦) LLGCV, (▪) LDGCV, (▴) DLGCV, (×) LGCV, (*) DGCV, and (•) GCV. Each data point is expressed as mean ± SD (n = 3).
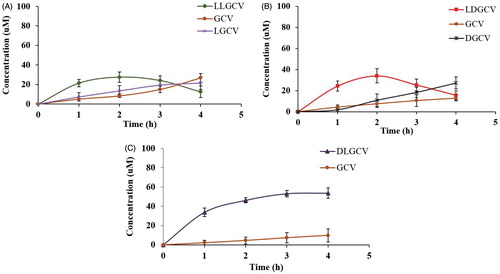
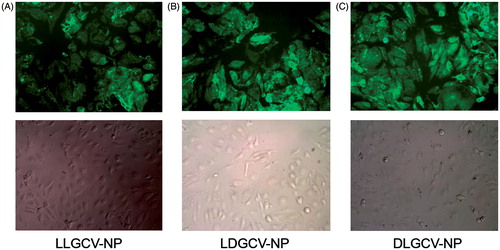
Figure 7. Fluorescence microscope images of HECE cells treated with FITC-labeled (A) LLGCV-NP, (B) LDGCV-NP and (C) DLGCV-NP at 3 h.